The Report Designer was a welcome addition for v7 but I suspect that few regard it as VdB's strongest feature. It is quirky, though with practice one can cope with that. However I still find it slow to use when designing all the many please list .... in columns type reports that clients seem to love. Not just slow but tedious too when a succession of such reports are required. Some clients have said they would like to tackle simple reports themselves but quickly loose enthusiasm when introduced to the VdB RD. There is a Wizard of course but that seems far too limited for most needs.
So the URG described below has gradually evolved with two aims. First, to provide a tool that will allow at least some competent users to quickly create their own reports, as and when they need them. And to do this without any programming or use of the RD. Secondly, to give Developers a tool that will take most of the tedium out of designing this kind of report. It may not produce the finished article in all cases but should at worst require no more than the final addition of any extra facilities that are required.
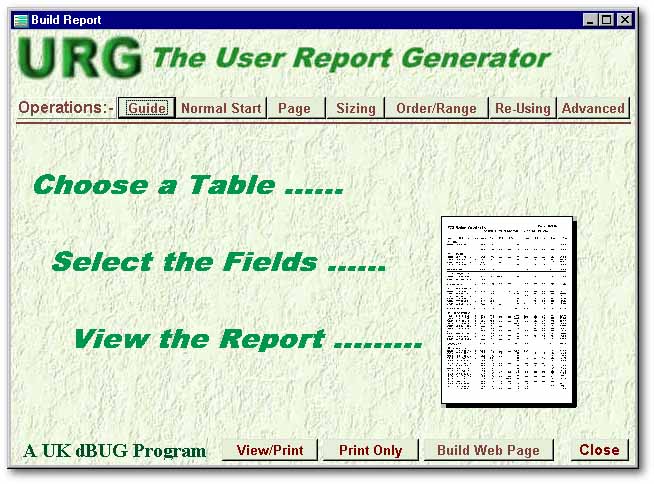
What is it?
In essence, it is a tool to create and run Reports without using the Report Designer. It will only handle reports that list records, you must still do more complex things like invoice layouts in the RD (or with Vic's Printer Class). At its simplest, a user needs do no more than select a table, select the columns (fields) required or all columns if they will fit and then select View or Print. The many additional options included allow for individual selection and positioning of columns, setting paper orientation and size, adjusting margins, adjusting font size in various ways so that the report fits the paper, selecting indexes, setting a range and specifying a filter.
Any set of selected options can be saved so that similar reports can be run subsequently without needing to remember and re-enter all the settings. Or a saved set can be reloaded and further modified.
The tool also allows a developer to design reports very quickly for the user (including while on-site) and to save all the settings for future use. Which means from within an application, by selecting a table and without using the design IDE.
The URG can be run as an independent, stand-alone utility. Or can be included in an application as an additional feature.
Background
The arrival of the Inprise Icon98 CD coincided with a request by a client for greater flexibility in the creation of new reports. The CD included a paper by Ken Chan with a description (and working example) of a Dynamic Report Layout. It was immediately evident that Ken's example could be adapted and extended to meet the client's request. Jørgen Feder in Denmark also spotted the potential and kindly shared his own excellent additions to the original programs. A Mark I URG was based on Ken's notes and examples, the many changes and new features by Jørgen plus further modifications, features and a new user interface by the writer.
The Mark II URG described here is virtually a new program though it has continued to make use of a lot of material by Ken and Jørgen. The main difference is that it now writes a complete Report Form that can be used for an immediate print or further edited in the RD if required. It keeps details of every table processed (plus options set for each report if required) in tables to allow quick repeats of previous reports. Note: as all the details are stored in URG2 tables separate report file names are not required unless so specified by the user.
Who Should Use It?
Any ordinary user who is capable of using other software (such as a Word Processor) and understands what a file is should be able to create simple reports. With some further understanding of page layout, fonts, point sizes and indices, then better and more selective reports will be possible. All without any programming.
I believe it should also help many developers to work better. Listing reports are not difficult to design in the RD but can prove tedious. This URG will allow such reports to be created and tested very quickly. The resulting Rep file should then be either immediately usable or relatively easy to modify to include any extra features outside the scope of the URG.
User Operation
The URG program can be run quite independently from the navigator, included as another report option in an application or built into an EXE file. For a new report, click the Normal Start button and choose the required table. A list of available fields will then populate a Listbox on the left of the form. Buttons allow some or all of the fields to be selected for the report by moving them to a Listbox on the right. The order of the fields across the report page may be changed. Click the View or Print buttons to generate the report.
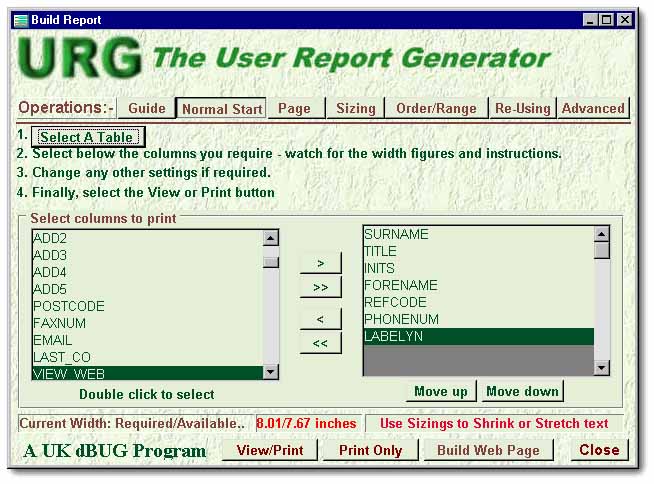
A potential problem with any kind of report wizard is that the selected columns (fields) may not fit within the width of the paper. Many of the available options handle alternative ways of dealing with this. Of these the simplest option is just to Shrink or Stretch to fit the paper width. This is done automatically by changing the point size. Often only certain records are required in a report and there are options to handle this. Re-specifying a report that may be needed several times would be tedious so there is a facility to save complete sets of options and settings.
Simple notes to explain all the options are included on each page. There is also a brief Guide that attempts to give fuller explanations than the space available on individual pages allows.
Although the user can enter a file name for each report, the default is to build each report, as it is needed, using the same URGPrint.Rep file name. As any set of options can be saved within the URG, why clutter up folders with lots of Rep files whose names and purpose are likely to be quickly forgotten if mainly for one-off listings?
Installation
The system comprises just six files:
Overall Structure
The URG comprises a single multi-page form, two graphics files and the Guide as a text file. As it is used, it will generate and maintain three tables:
The form, RepMaker.wfm, comprises 15 pages. Six of the pages are selected by the user and handle the various options available. Page 1 is just an intro page, page 8 handles a set of Guide notes through an Editor control and the remaining pages are used as needed for the listboxes, entryfields etc. required by some of the main options. To ease maintenance problems with the many controls, each has their page number included as the last digit of their name
Again to ease both maintenance and the detailed programming notes below, the many functions have been arranged into sections, each with a descriptive header.
Ken Mayer's excellent Preview.wfm is used for the View option that shows each report after it has been built.
Ken Chan's original PrntCols form allowed the user to select the columns required in the report by moving them from a source to a destination listbox. The order in which the columns are printed could then be changed. He also included the ingenious Shrink and Stretch options to enable the selected columns to fit the width of the paper. These options have been retained. As too have a number of options by Jørgen. However, note that option means just what it says, none need be set if you are happy with all the defaults.
Program Summary
Wherever possible, source code has been made as readable as possible. Well spaced out, lots of comments, meaningful variable names and little attempt to combine several program lines into one more elegant but possibly less clear line. It has been assumed that others may wish to modify the code to suit their own needs and so will want to understand what is happening. Sharing values between functions by passing parameters proved a nightmare as that value could be needed in several quite different places. So most such values are handled as Form properties. This may not be the purist way but it solved many problems and works well. No custom controls or forms have been used - but these are strongly recommended! It seemed better to leave each user to replace stock controls with their own custom alternatives using the Search and Replace tool.
A number of functions are based on code originally written by Ken Chan and Jørgen Feder. I am in some difficulty here as I don't feel that I am either competent or authorised to explain them in my own terms. I will try to give some general guidance, especially where I have made my own changes to individual routines, but otherwise I would refer you to Ken Chan's original paper, available as a download from the Library page of the UK User Group web site and elsewhere.
The RepMaker form comprises 15 pages. It uses a JPG file for the background and main title. Then:
Open and Close Section
Both Open() and ReadModal() functions are included to allow use as either non-modal or modal. They over-ride the Form.Open() and Form.ReadModal() methods respectively and call an Init() function
This checks that the three tables used exist and if not calls BuildTable to create them. The tables are opened with Form... names to simplify reference to them throughout the program:
Form.qHead = new Query()
Form.qHead.sql = 'Select * from URG2Head.dbf'
Form.qHead.active = True
// shorten rowset references and set default index
Form.qh=Form.qHead.rowset
Form.qh.indexName = 'HEADTABLE'
Note that shortened references are defined and a default index order is set.
URG2Head.dbf comprises a record for every table selected in the URG for a report. Besides the table name it contains fields for the currently selected Font Name and Point Size.
URG2Detl.dbf comprises a record for every field in each of the tables selected in the URG for a report. Besides the Field name and Table name it includes fields copied from a Structure Extended table, i.e. Field type, length and decimal places. A ColTitle field holds the text for the column heading, it defaults to field name. ColWidth is calculated from the field length and current font and point size settings. It is the width to be used for the column in the report. CalcField flags whether the user has defined a calculated field for this column. If so, the FieldArray field holds, as a string, an array of the specification for the calculated field.
URG2Opts.dbf comprises one record for every set of options saved by the user. So there can be none or many for any table. The options set for the last report processed are held by default. The use of the many fields in this table will be described in the ... Options .... sections below.
Once the Queries are defined, a grid used on the Re-Use (or Options) page can now be datalinked:
form.gridOptions6.dataLink = Form.fr
form.gridOptions6.columns["COLUMN1"].dataLink
= Form.fr.fields["DESCRIPTIO"]
Form.fr.first() // Force grid to top of table
A PB_Close() function ensures that the three tables are closed and released.
Form Properties Section
This comprises two functions. First, FormPropDefaults() sets all the default Form properties. Note that it is not run when the program is opened initially. Instead it is run when either a table is selected for a report or a set of options is loaded from the URG2Opts table. In this way any existing settings are replaced by the defaults before any of the settings are then changed by user selections or the saved options.
Second, FormPropNull() is a near mirror of FormPropDefaults() but stubs out each custom property by giving it a null value. Doing this reduced GDI leakage by 3 to 4%.
Build Tasks Section
This handles three build operations. Build_Tasks() is called by the Select a Table on page 1. As it involves some processing and uses another page for file selection, all the main buttons (on Page 0) are reset with the Enable and Visible properties set to False. This is also done as required on other pages. FormPropDefaults() is called to reset all Form properties and then GetDbfName() for user selection of table name.
Where a table is selected for the first time, BuildStructureFile() uses the COPY STRUCTURE EXTENDED command to extract all the field details for the selected table. BuildAppend() then appends one record to the URG2Head table and a record for each field to the URG2Detl table. Each new record is filled with file/field details and defaults as described in the Open and Close Section above.
The BuildTable(cTable) function is used to create the three URG2.... tables if they do not already exist. This allows the URG2 to be initially supplied as just the RepMaker.wfm file plus the graphics and text files. The CREATE TABLE command is used and the required indexes created.
File names Open and Close Section
Unless a set of existing options is selected from the ReUse page, all reports start with the user's choice of table through DetDbfName(). The array .Dir() method is used to build an array of all dbf file names in the current folder and these are sorted into a second array (TableNames). Note that blank elements are added to the array if there are less than 11 tables, this is just to improve the appearance when the datasource for the Listbox on Page9 is set to the array. An Abort option is also included. Selection from the Listbox is by a LeftDoubleClick as if an OnClick event was used the page would not hold at 9 until a selection was made. This is handled in LB_LISTFILES_onLeftDblClick(). Note that both the full path and the table name only are saved to Form properties although the former is not used at present. BuildURGFile() is called to check whether the selected table is already in the URG2 tables. If not, functions in the Build Tasks section are called to add the relevant records. The Source array is created and populated:
Form.source = new Array()
If Form.qd.First()
Do
Form.source.Add(Trim(Form.qd.fields['COLTITLE'].value))
Until Not Form.qd.Next()
Endif
// Populate arrays
Form.LB_SOURCE2.datasource := 'Array
Form.source'
Form.LB_DEST2.dataSource := "Array
Form.dest"
Columns Move Section
The six functions in this section allow the selection of the columns (fields) required in a report and then an optional change of sequence of these columns across the report page. The code dates back to Ken Chan's paper at Icon98 though various detail changes have been made since. The four selection functions are an example of a Mover facility and the principles have already been documented in several places, including dBulletin Issue 2. So another detailed description is not included here. However note that each of the selection functions calls UpdateWidth() to re-calculate the overall width required on the report for the current font, point size and columns settings.
Page Settings Section
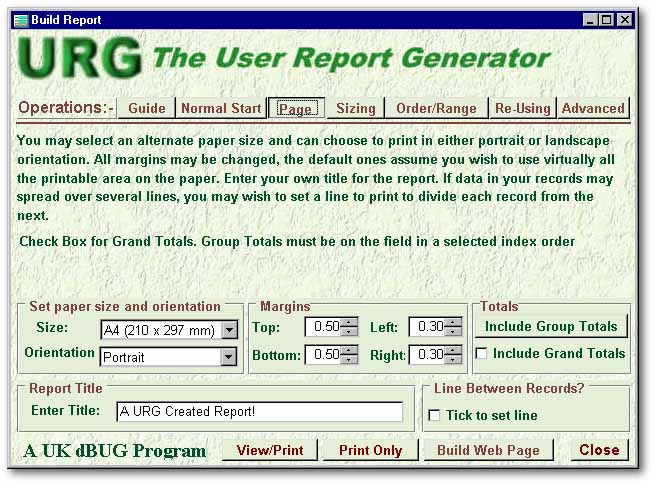
Comboboxes allow the selection of paper size and a choice between Portrait and Landscape. Sizes_OnChange() handles both choices, resets Form margin values and calls UpdateWidth() to recalculate the available print width. A switch to Landscape is one way of handling a selection of columns that prove too wide to fit at any acceptable point size in Portrait mode. The range of paper sizes is just two. In the UK we use A4 for virtually everything so if you are not in Europe you may well wish to add extra sizes and modify the code accordingly. Two further very simple functions handle a user entered report Title and an option of a line under every record. This is useful where multi-line calculated fields are specified.
The Settings Page include options to adjust all margins and to include overall totals on a report. These controls change the relevant Form property values direct and so require no functions.
Group Totals Section
Setting Group Totals requires a little work and so is selected through a button instead of the checkbox for the overall totals. Page 12 is used to show the field for the currently selected index (or first field if it is a composite field index). If this will not give the required grouping, the user must select another index from the Order/Range page and then again click on the Group Totals button. A Finished button calls GroupFinished(). After checking that a field has been selected a flag set to force the StreamReport() function to include the group totals on the report. For Grand Totals, a tick in the CheckBox will again force StreamReport() to show overall totals
Page Sizings Section

Personal experience suggests that a common problem with reports is that clients want more data included than will readily fit the paper width. Achieving a best fit easily should be a feature of the VdB Report Designer but in fact it can require painstaking manual adjustments by the programmer. This URG offers several solutions. A change to Landscape and adjustment of page margins have already been mentioned in the Page Settings section. The Sizings Page offers three more methods.
The simplest to use are the Shrink/Stretch to Fit options. As columns are selected the required width is updated, compared with the width available and is reported on both the Normal Start and Sizing pages (1 and 3). Warnings appear if the required width exceeds that available. Shrink/Stretch offers a quick and dirty solution. The method originates from Ken Chan's paper though it now works somewhat differently. In effect point sizes are adjusted up or down until the selected columns do fit. The UpdateSizeHint() function that does this is described further in the next section. In many cases this simple method may prove adequate but it can result in a point size too small for comfort.
To give the user more control, a Settings for Report section allows selection of a different font and/or a different point size. An Edit Report Settings button allows choice of a different font and/or a change of font size. These settings will apply to all but the overall titles in the report
Sometimes simple changes to the overall settings will not be adequate. For example, a narrow field with a width such as width 3 or 4 may have a wide descriptive name. Or a wide field may have a width to handle a possible maximum length that will rarely arise. These can be changed in the Settings for Field section after clicking on the Edit button. The current column width is initially based on the selected Font, selected Point Size and the Field Width. The space available for the column heading will change as the column width is adjusted. Entry into the field will appear in the current Font and Point Size. To maintain a tidy report layout, the set default is for columns not to wrap. A Check Box allows wrap where this is preferred.
Calculate and Show Widths Section
The space needed for each column on the report is dependent on the Font and Point Size selected and the field widths. The overall total of all the column widths has to fit within the paper size selected for the report. So that the user can see what is happening and maintain control over this, both column and overall widths need to be recalculated whenever any relevant change is made.
A CalcCharWidths() function returns the estimated average width per character for each font and point size. At time of writing this is based on quite simplistic constants. Although it is hoped to replace these with more accurate figures later, it should be noted that with proportional fonts individual characters vary considerably in width. To allow for this the constants are rather generous.
UpdateWidth() is called in many places through the program. Its prime purpose is to write the current used and available width to objects on page 2 and page 4. Also to highlight these in red and add further text if the required width exceeds the width available. To obtain the current figures GetTotalWidth() is called with the Form.Dest array passed as a parameter:
form.tl_width4.text:=form.widthTextLabel+;
form.getTotalWidth(form.dest)+"/"+form.rswidth+'
inches'
form.tl_totWidthFig2.text:=form.getTotalWidth(form.dest)+;
"/"+form.rswidth+' inches'
GetTotalWidth() gets the name of the selected table and sets a filter on the URG Details table based on that name:
cDbf:=Trim(Form.dbfNameOnly)
Form.qd.Filter = "TABLENAME = '"+cDbf+"'"
A For .... Next loop through all the elements in the passed array (the columns selected for the report) is made to identify and find the record on the URG Details table. From this the required column width is extracted and accumulated. For fields of Type Numeric an extra 0.1 inches is allowed. This is because numeric fields are right justified and so would otherwise butt up against a left justified character field to the right.
For nCtr = 1 to aColumns.size
cText:= Trim(aColumns[nCtr])
// Column name for this pass
lFound:= Form.qd.FindKey(Upper(cText))
If lFound
nWidth+=Form.qd.fields['COLWIDTH'].value
// add extra 0.1 if numeric field
as space needed on right
nWidth+=Iif(Form.qd.fields['FIELDTYPE'].value='N',0.1,0)
UpdateSizeHint() handles the Shrink/Stretch option. After checking that there are columns in the Form.Dest array it calculates the current ratio between width available on the paper and width required:
nScale := form.rswidth / form.getTotalWidth( form.dest )
Then, depending on the radio button selected, it displays the ratio as a % on the form together with an appropriate hint. Finally it calculates two figures to be placed in Form properties:
Form.PointAdj=(Round(10*nScale,1)-10)+Iif(nScale>1,0.1,0)
Form.WidthAdj=(10+Form.PointAdj)/10
Form.PointAdj is a + or - figure that is added to the currently set point size when the report file is written. It is in 0.1 point increments. Form.WidthAdj is a factor that is applied, by multiplication, to the current set column widths when the report file is written.
Index, Range and Filter Section
GetIndexInfo() uses the Tabledef() class to extract index names and index expressions into two arrays, Form.indname and Form.indexpr. PB_Index_OnClick() combines these into a Form.IndexList array and adds blank elements to a max of 12 to improve the appearance when shown in a listbox on page 10.
User selection (by left double click) is handled by LB_LISTINDEX_onLeftDblClick(). The index name and index expression are placed in Form properties and Form.sequence is set to true so that other options can check whether an index has been set. The full index name and expression are shown on page 5.
For setting both group totals and range values, the name of currently index field is required. The index expression may include several fields of which one or more may be embedded in functions such as Upper(). To eliminate all but the first field a check is made for a + operator:
nPos:= at( "+", cExpression)
// If no + it must be a one field
index - so give nPos a large value
nPos:=Iif(nPos = 0,50,nPos)
A search is then made for the field name of each column in the Form.dest array in the index expression, but only the substring before the + where applicable.
For nCtr = 1 To Alen(form.dest,1)
cDestName:=Trim(form.dest[nCtr])
// Find row in Details table for
this column
lFound:=Form.qd.FindKey(Upper(cDestName))
If lFound
// Get Field name from
row in Details table
cDatName:=Trim(Form.qd.fields['FIELDNAME'].value)
// Check if this field
name is in the index expression
If Upper(cDatName) $ Upper(Left(cExpression,nPos-1))
// This must be the
first field in the index expression
// so place it in Form.Group
property
Form.Group = cDatName
When the field name is found, it is placed in the Form.Group property.
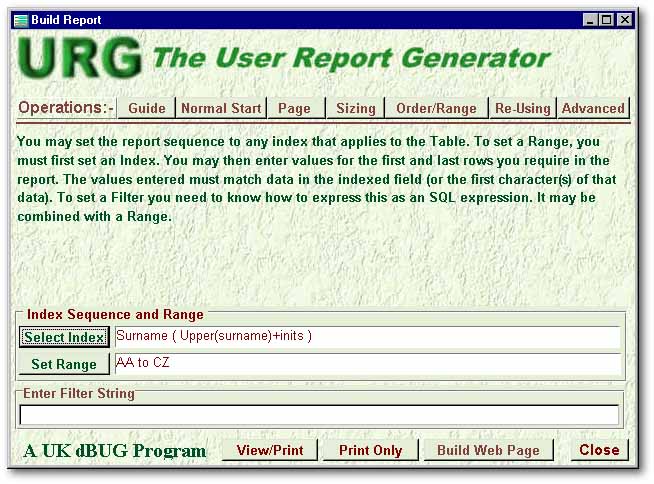
For a Range, the user needs to be reminded of the prime indexed field and to be able to enter range values as the correct type. This is handled by SetRange_OnClick() which shows the field name on page 11 and prepares the entryfields for the start and end Range values. A Do Case ... is used to put an empty string, empty date or a Picture for numeric data in the entryfields.
PB_RangeNext_OnClick() checks that a value has been entered and then checks whether the indexed field is embedded in a function. If so, entered strings may need to be converted to Upper Case or dates to DtoS() before they are saved to the Form range properties.
To set a filter it is currently necessary to type in the full string with all the "" and ' required, far from ideal. However as there have been hints that a Filter Builder is likely to be included in a forthcoming upgrade it seemed sensible to wait for and use that and not attempt to invent the same wheel.
Save Options to File Section

This facility extends the URG from a sort of super wizard to a far more powerful tool. It is based on an original idea by Jørgen Feder but has since been extended to handle the many extra options now available. To understand how it works we must look again at what the three URG2....dbf tables do.
The OptionsToFile() function handles both the automatic and user implemented Save operations. The first is from the pb_View() and pb_Print() functions before the report itself is streamed, the second from the Save button on the Re-Use page via pb_OptsRowSave(). Most settings are held in Form properties so it is just a matter of putting these in the relevant fields. The Form.Source and Form.Dest arrays need a little work though and ArraysToString() is called convert the arrays into strings that can be stored in a memo field. This function, originally written by Jorgen, places each element of the arrays within inverted commas, separated by commas and the whole within curly brackets. Note that for the Form.dest array the column titles are used to search for the corresponding field names which are actually stored in the string. This is in case the user changes column titles between saving a set of options and later re-loading them.
Load Options from File Section
This is of course the reverse of the above. Besides placing the saved values in all the Form properties, various fields, spinboxes, etc., on the URG pages are updated. The two arrays, saved as strings, need to be restored to the original format and the listboxes populated:
cString = LEFT(c,AT('|',c)-1)
form.source = &cString
cString = SUBSTR(c,AT('|',c)+1)
form.dest = &cString
At this point Form.dest comprises the list of stored field names so each in turn is replaced with the column title before the two listboxes on page two are re-populated.
form.lb_source2.dataSource := "array
form.source"
form.lb_dest2.dataSource := "array
form.dest"
Finally, UpdateWidth() is called to recalculate and show the available and required widths on the report.
Prepare Print/View Section
PB_View() calls ReportStream() to prepare the Rep file, OptionsToFile() to save all settings as Current and then Ken Mayer's excellent Preview.wfm so that the newly created report can be viewed. PB_Print() duplicates the first two calls and then instantiates and renders the report after setting the report Output property to 1.
Stream Report Section
This in a sense is the culmination of all the work done elsewhere in the application, a report form as specified by all the user options is finally created. ReportStream() is a long function, arguably excessively long but in this instance splitting into several smaller functions seemed to increase complexity without improving clarity.
After defining and initialising variables, setting a filter to the selected table and setting the index to the column titles field, values are placed in three vital variables:
nPoint :=h['POINTSIZE'].value+Form.PointAdj
nHeight :=(nPoint*2)/100
cFont :=Trim(h['FONTNAME'].value)
nPoint will default to the point size set (or accepted) by the user. However if the Shrink/Stretch option is invoked it will be adjusted by the value placed in Form.PointAdj. Moreover, nHeight has been rather arbitrarily set to one fiftieth of the point size but as the form metric will be set to inches this will give a height of 0.2 inches for a point size of 10. This may not be the ideal ratio and will need to be adjusted if a metric other than inches is preferred. cFont just takes the Font selected (or accepted) by the user.
If the Advanced option to save the report to the user's own file name is flagged, a simple form (Rep_Name.wfm) is over-layed for entry of the name. The default is URGPrint.rep. Note that each fresh report will therefore over-write the previous one. This may seem strange but remember that all settings needed to reproduce a report can be saved for re-use so why create lots of rep files?
To stream all the code to the report file the long established SET ALTERNATE TO <file name> and SET ALTERNATE ON have been used. Or, to be precise, ..... TO &cRepName..rep so that any entered report name could be used. It was found that the macro operator would not work on the complete report name so, for those who have not seen this before, the first period terminates the macro and the second period is the one that normally precedes the Rep.
Some may prefer to use the File Class and Puts() method. There is though a little quiet satisfaction in using a command that has existed for at least 22 years to build a Windows program. I doubt if the original author of dBASE II ever envisaged that!
The generated report file is intended to match in all significant respects a file built in the normal way through the Report Designer. This means that a generated report can subsequently be opened in the RD and further revised if required. So most of the lines streamed are just typical code to be found in a report form but with values from variables substituted wherever this is needed. Many sections of the code are within If ... Endif constructs that check whether they have been specified by the user.
The blocks of code for the report class itself, the query, printer, page template and similar sections should be self evident to anyone who has worked with the VdB Report designer and so are not described here in detail. Hopefully the blocks handling the overall report title, date and page number need no detailed explanation. The font, size and position of these can easily be modified if the supplied defaults are not suitable.
The provision for multi-line calculated fields could cause the data for one record to be split over two pages. Clearly not ideal so a OnRender event on the Detail Band is included
? ' with (this.STREAMSOURCE1.detailBand)'
? ' height = '+nHeight
? ' onRender = class::DetailBand_OnRender'
? ' endwith'
Note that OnRender is used as we need to know whether a page break is required after each detail band is printed. Now for the called function:
// force page break to avoid split of multi line records
? ' function DETAILBAND_onRender'
?
? ' If (this.streamframe.height -
this.RenderOffset)<'+nNewPage
? ' this.parent.BeginNewFrame()'
? ' Endif'
?
? ' return'
The read-only RenderOffset property contains the current position text has reached down the StreamFrame and so can be used to calculate when a page break is required. Similar onRender events are included if overall and/or group totals are specified.
A For ... Next loop is used to handle each of the operations needed to extract data from the table. The first of these loops also handles the column headings. The loop is always through the Form.dest array which contains the columns selected by the user. The text in each element is the column title which defaults to the field name but may have been changed by the user. So a look up with FindKey() is required to locate the correct record in the URG2Detl table before extracting required values:
cDestName = Trim(form.dest[nDest])
// Find row in Details table for this column
lFound = Form.qd.FindKey(Upper(cDestName))
If lFound
// Get data from row in Details table
cDatName:=Trim(d['FIELDNAME'].value)
nWidth :=d['COLWIDTH'].value*Form.WidthAdj
nAlign :=Iif(d['FIELDTYPE'].value
= 'N',2,0)
The Colwidth field holds the normal width of each column but must be modified by the Form.WidthAdj value if the Shrink/Stretch option has been used. For numeric fields both value and column heading need to be right aligned. The code for handling one field in the Detail band can now be written and then the code for the column heading. The final task in each circuit of the loop is to calculate the starting position of the next column:
nPos+=nWidth
nPos+=Iif(cFieldType = 'N',0.1,0)
// extra space if numeric
Note that for numeric fields a little extra space is allowed. Otherwise the right justified heading and value of a numeric field would abut without any space against a left justified character or other type field.
Similar loops are used for the Group and overall total bands, where these have been specified by the user. It is though necessary to define each band first (a report in effect assumes a Detail band). Providing the first field is not numeric. a simple Group or Totals description is placed on the left of these bands. As totals are usually self evident on a report it was felt that such simple descriptions would normally suffice. If more is required it would probably be best to insert this in the RD where the amount of space available before the first numeric column would be visually evident. A line below each Detail band is inserted if specified by the user.
If a calculated field has been specified, a CanRender event will have been set in the Detail band for the relevant field. The code for the function called uses the array created when the user specified which fields were to be combined. The array was stored as a string in the URG2Detl record for field and first must be changed back into an array:
cString = d['FIELDARRAY'].value
form.tfields = &cString
A Do Case ... structure inside a For .... Next loop is used to build the report code from the data in the array elements:
For nCtr = 1 to Alen(Form.tfields)
?
Do Case
Case Form.tfields[nCtr]
= " "
? ' cText+="
"'
Case Form.tfields[nCtr]
= "~"
? ' cText+=","'
Case Form.tfields[nCtr]
= "<BR>"
? ' cText+="
<BR> "'
Otherwise
cDatName:=Trim(Form.tfields[nCtr])
? ' cText+=this.form.'+cFname+'.rowset.fields["'+cDatName+'"].value'
? ' cText:=Trim(cText)'
Endcase
Next
?
? ' this.text = Trim(cText)'
?
? ' return true'
Note that a space, comma or page break ( <BR> ) can just be inserted in the text, also that the <BR> needs a space either side. The tilde ~ is used in place of the comma in the array string to avoid confusion with the comma separators in that string. For fields, the full rowset code needs to be built before adding to the cText string.
The final line in the function may look odd to some, i.e. COMPILE &cRepName..Rep During testing it was found that a fresh rep file did not always automatically force a compile! Alan Katz has said that the coming upgrade to dB2K will allow an EXE file to call an external compiled file. By using a fixed name for reports such a call could be included in the EXE and so be used to run reports generated in that EXE.
Web Page Build Section
The aim here is to provide a basic listing in web page format. The assumption is that few users are likely to understand web page design or the scope and limitations of HTM. So a page of pre-fixed design is used. A Title, notes about the use of Ctrl-F, a credit line for VdB, column headings and the data itself in a table. A supplied background is the default.
The main code is in the HtmStream() function. As for the Rep file, the Set Alternate etc. method is used to stream HTM code to a file. The code is based on that produced by the html clas.cc in the dUFLP library. However it seemed simpler to just stream the code direct and not via the cc functions. The title and notes lines are just straightforward HTM with nothing warranting a comment here. The column headings are taken, via a For .... Next loop, from the Form.dest array. There is a lookup on the Details table to identify numeric fields where the column heading should be right justified:
If Form.qd.fields['FIELDTYPE'].value
= 'N'
? '<TH ALIGN=RIGHT>
' // Right justify if numeric
Else
? '<TH ALIGN=LEFT>
' // Otherwise left justify
A repeat of the same loop is embedded in a Do ..... Until structure that loops through all records in the Report table (or those constrained within a SetRange() or Filter). For numeric fields, beside right aligning, a picture template is created for use with Transform() to achieve vertically aligned columns. The rowset string and the format string are then combined with Transform() into the cField variable that is used with the macro & operator to stream out the relevant field value
cField:= Trim(Form.qd.fields['FIELDNAME'].value)
cField:='qtr.fields["'+cField+'"].value'
If Form.qd.fields['FIELDTYPE'].value = 'N'
// If numeric we need to format and right justify
nLen:=Form.qd.fields['FIELD_LEN'].value
nDec:=Form.qd.fields['FIELD_DEC'].value
// Build format string
cFormat:='"'+Replicate('#',(nLen-(nDec+1)))+'.'+Replicate('#',nDec)+'"'
cField:='Transform('+cField+','+cFormat+')'
? '<TD ALIGN=RIGHT>'
? &cField
This method will handle up to about eight columns, depending on their widths. Data will wrap within a column width where the need arises.
If anything more sophisticated is required or a different page layout is preferred, it should not be difficult for anyone with some knowledge of HTM to modify the code in the HtmStream() function.
Calculated Fields Section
This is intended to primarily handle field combinations rather than numeric calculations but can give a little help with the latter. Page 13 is used for the user interface. CalcField() needs to build another array though before switching pages (and hiding buttons etc. of course). A combined field can be built from any fields in the table, not just those previously selected from the report. So a new array is needed:
Form.tfields = new Array()
If Form.qd.First()
Do
Form.tfields.Add(Trim(Form.qd.fields['COLTITLE'].value))
Until Not Form.qd.Next()
Endif
In fact two arrays are used, the existing Form.Dest array and the new Form.tfields so these must be populated:
Form.CBOX_FIELDLIST13.datasource :=
'Array Form.tfields'
Form.CBOX_DESTLIST13.dataSource :=
"Array Form.dest"
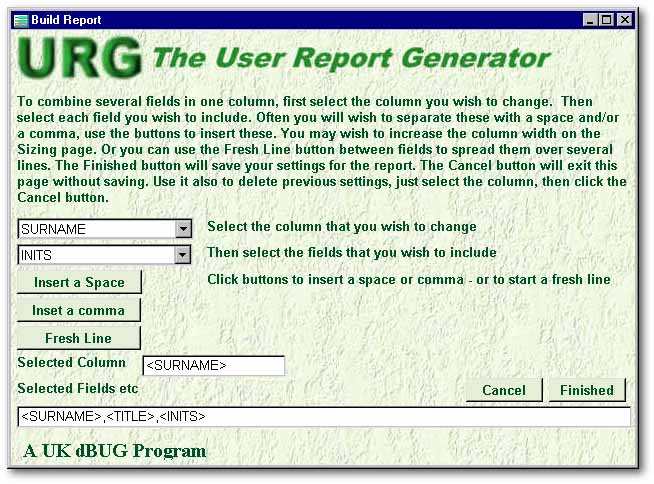
We can now change to page 13 and start work. This option requires that a column selected for the report is then expanded (or changed) to include other fields. So the first step is to choose a column from the Form.dest array. Then each required field is selected in turn from the Form.tfields array. This must include the column from the Form.dest array if it is required. Three buttons allow a comma, a space and a page break (or any combination of these) to be placed between the selected columns. The base column from Form.dest is shown on the page and below it a string of the selected fields, commas etc. is built up as a guide to the user. This string cannot be edited, it would really be quicker in most cases to just cancel and start again.
The prime aim of this facility has been to allow combinations such as:
Surname, Title Initials
Address line 1
Address line 2
Address line 3
to be easily built. So it has been assumed that all such combinations will require the relevant field data to be trimmed. As fields and separators are added though the buttons they are added to a Form.calc1 array. CalcFieldFinish(), called by the Finish button, converts the array into a string using the same technique as ArraysToString() described above. The resulting string cStr is saved to the relevant record in the URG2Detl table together with a flag to indicate a calculated field applies and a flag to indicate that Wrap must be True if a line break is set.
Although the field combination, as described, is likely to be as much as most users could tackle, this option can also help a developer to prepare the groundwork for more complex calculated fields that could then be coded out in the Rep file after a View has been run. Selecting just a Form.Dest field and one field from Form.tfield will put a skeleton onRender function in the Rep file. This can then be coded to, for example, substitute a numeric calculation for the default field data. Or data can be sucked in from other tables. Add Queries for any such tables to the body of the Rep file and typically set an appropriate index. In the CanRender function it is then possible to use FindKey() to locate, for example, full customer details from a customer id in the main table and to build the Surname, Title, Initials string for printing in the final report. Best to save such rep files under another name of course to avoid them being over-written! Also, if you intend to build a multi-line calculated field, add at least one line break so that the DetailBand_OnRender code is written to the Rep file.
So although the URG cannot handle queries containing related tables as such, it can make it much easier to build reports from linked tables.
Advanced Options Section
Besides Calculated Fields, covered above, and Check Boxes that can be flagged, a Delete Table option operates through the DelTable form called by DeleteTable(). The form comprise just a grid showing table names plus Delete and Close buttons. If a table is selected and confirmed for deletion, then all records in the Details and Options tables are located and deleted. Finally the record in the Header file is deleted.
Page Change Section
Seven similar functions are called by the top row of buttons and change to the page selected. They each include a call to the ChangeButton() function. This sets the last button clicked to False so that it will appear depressed on the screen. EnableButtons() is used to grey out buttons while any processing is taking place and so prevent user selection of a button until processing is completed. HideButtons() is used to conceal the main buttons (which are all on Page 0) while pages 9 and above are in use.
Utilities Section
This currently contains just the Repaint() function, taken from dUFLP, to re-draw the screen where necessary.
Limitations
The aim from the start was to make the URG a tool suitable for many users. They would be free to use or ignore options they did not understand, depending on their individual skills and experience. This aim has imposed some limitations in respect of use by developers.
Early builds of the Mark
II URG used a Notebook instead of a multi-page form. Although this worked
fine in the functional sense it proved a voracious eater of GDI resources.
This included both overall usage of GDI when the form was running and a
failure to release GDI when the form was closed. Switching to the multi-page
form now used significantly reduced that GDI usage and loss. Testing in
both W95 and W98 environments also revealed significant differences. An
alternative to the final URG II program was in fact built and allowed detailed
comparisons to be made.
| Operation |
|
|
|
|
| Under Windows |
|
|
|
|
| VdB Loaded |
|
|
|
|
| RepMaker Loaded |
|
|
|
|
| Set columns, options
etc. |
|
|
|
|
| Preview a Report |
|
|
|
|
| Preview Closed |
|
|
|
|
| Re-visit all pages |
|
|
|
|
| RepMaker Closed |
|
|
|
|
| Vdb Closed |
|
|
|
|
The above figures are in line with previous experience. In broad terms, GDI usage in W95 is similar to that in W98 but the leakage that seems normal in W95 may not arise in W98. In W95 inclusion of a Notebook sharply increases GDI usage and may not release that usage until VdB itself is closed. Two changes were then made to minimise leakage. The Notebook object was specifically released and this one step eliminated all the extra leakage in the Notebook version. The second change was to stub out all Form custom properties on closing the form and this recovered a further 3 to 4% of the leakage on both versions. The RepMaker.wfm available for downloading with this article now shows leakage of only 2% in W95 and 1% in W98.
The User Resource figures were also monitored but showed lower usage and little variation between the four alternatives in the above table. Relative to GDI, they do not seem to be significant.
Conclusion
As the Mark II URG evolved, ideas for further options kept popping up faster than existing ones could be coded. But would too many options make it too complicated? It seemed sensible to make the version described above available and wait to see if others do find it useful and to see what they think should be added or changed. Hopefully some will also suggest how! It is far from a solution to all report creation but it should at least help with a good proportion. It is already doing so for me. It should also be easy for developers to add any options they feel that they need (and hopefully contribute them for future upgrades)
Acknowledgements. To Ken Chan for
the original idea, Jørgen Feder for all his further contributions,
Jean-Pierre Martel for testing and many good suggestions. especially in
respect of GDI and to Ken Mayer for his Preview.wfm and report How papers.
To Elwyn Rees, Jon Webb, Duane Bays and Dan Howard for testing the program
and to Derek Money and John McKendry for proof reading.
To download the User Report Generator, click here.