Tricks With Reports and Labels

by Ken Mayer, Senior SQA Engineer, dBASE Inc.

Special Thanks to developer Charles Overbeck for extreme
patience in answering tons of questions with incredible detail ...


Example files available in reports.zip


The report designer in Visual dBASE is a powerful tool, and something that many have wanted to see for a long time -- among other things, it is a completely two-way tool, like the form designer.

However, just like anything of the complexity of the report designer, there are a lot of techniques that are not necessarily obvious (sometimes called tricks) that can be used to make your reports that much more powerful, and look better. That's what this paper is about.


Topics Covered

The following items are covered in this paper -- using the hyperlinks, you can go straight to a topic of interest, or you can scroll down ...


Some Report Designer/Engine Basics

Report Objects
Some of the following is based loosely on information in the Language Reference (Chapter 17 - Report Objects, and is also covered in the onLine help in the "Report objects" help topic), and is here to help understand what is going on in this powerful but sometimes confusing tool.

Like a form, a report is really a container for a bunch of objects, with some code of its own, since the report is an object with properties and methods (also just like a form). The report object hierarchy works something like the following:

How a Report is Rendered
A report gets rendered (or generated) by calling the report's render() method. The sequence of this generation is along these lines:

A flow-chart

The Report Designer
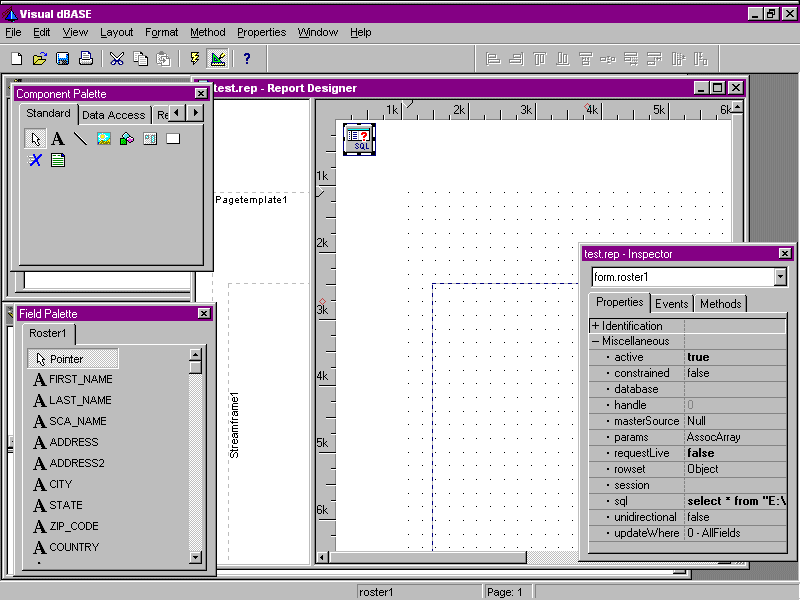
When you are using the report designer, you will see a very busy screen, and this can be a bit confusing at first -- although if you've used the form designer you may be used to it, to an extent.

First, there are up to four palettes (which may be floating, they may be turned off, and so on). These are:

Form Designer

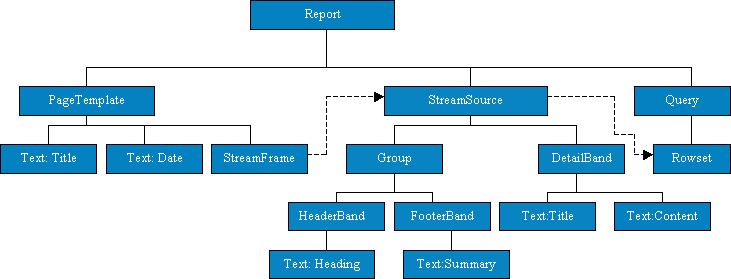
In addition, there is the report designer itself -- this actually has two parts, although the default is to show just the report. These are called panes (it's a window) -- the pane on the left is called the Group pane, and the pane on the right is the Report pane. When you first open the report designer, there is a vertical bar on the left of the Report pane -- if you drag this bar to the right, you will see the Group pane.

The Group Pane shows the hierarchy of objects in the report down to the bands (it does not show controls). The Report Pane shows the report appearance with the corresponding structures shown in the Group Pane -- this uses live data.

Metrics
The default metrics for the report designer are twips, there are 1440 twips to the inch (a twip is a "twentieth of a point"; there are 72 points per inch). This, for people used to thinking in inches, (or centimeters, or ...) can be a bit mind-boggling, and trying to determine how wide a page is, or how far from the left margin you wish to set an object, can be difficult at best. As it turns out, and some of you reading this have probably already found this, but sometimes what seems like it should be obvious isn't ... you can change the report metrics for your reports! If you think in inches, then by all means, change the metrics for your reports to inches. The metric property is found in the inspector for the 'form' -- if you are designing a report, the form is the report -- and if you click on it, you will see a combobox with several options: Chars; Twips (default); Points; Inches; Centimeters; Millimeters; Pixels. Most people don't think too clearly in anything but Inches, Centimeters or perhaps Millimeters -- so you may want to get used to setting the metric property as soon as you start designing a report (you could use a custom report that set this and any other properties you commonly change from the defaults for you ...). Throughout this paper, I am using "inches" as my metric setting.

Top/Menu


Some Hints ...

The more you work with the report designer, the more things you find that can make it easier to work with. The following are hints from various sources which may make designing your own reports easier:
Field Labels
When designing your report, and dragging fields from the field palette, the report designer places labels for each field onto the report. The default is to place them above the field, and you can change this setting to the 'left' or to simply not display them at all. Note that you get field labels in reports, but not when designing labels.

Some folks have discovered that it's easier to turn these off, and then to place your own labels where you need them. This can be done by right clicking on the field palette surface, and then select the "Customize Tool Windows ..." item from the popup menu. In the dialog that appears, in the "Add field label" section, select "None".

Next time you drag a field from the field palette, no label will appear. You then can either place your own on the pageTemplate above the streamFrame, or anywhere in the detailBand, if that is your desire, and so on.

Alignment Tools
When you are working in the design surface, getting your controls to line up can be bothersome. You can do it the hard way -- going to the inspector for one control, looking at the values, and then setting the same properties for other controls; or you can use the alignment tools.

When you are in the report designer, in the toolbar (and in the "Align" menu), are a set of toolbuttons designed to help you line up controls. To use this, select two or more controls that you wish to line up (use <Ctrl> and the mouse to select them), and then you can line them up on the left, the right, top or bottom. (You can also make your controls the same size -- height, width ...)

In addition, you can center controls horizontally in the band your are working in (or the pageTemplate) by clicking on them and going to the Layout menu, and selecting "Align" and then "Center Horizontally in Window". (In most cases you probably don't want to "Center Vertically in Window" ...)

Lines
If you want to place a line between detailBands, there are some options, but experimentation has shown that your best bet is to place the line at the top of the detailBand, not at the bottom, or in the group headerBand or footerBand (if you are using groups). This way, you always have the line at the top of the detailBand for each row that prints ...

Metrics
As noted elsewhere in this paper, setting your report metrics to a value that makes sense to you is a good idea -- twips are hard to work with unless you're a typesetter.

AutoSort
Also as noted in the section of this paper on groups, you may wish to set the value of this property (of the report itself) to false -- otherwise you may find your report sorting in ways you didn't expect.

Autosort is used by the report designer to modify your query's SQL statement, so that the data "automatically sorts" the way you need it to. This can be useful in some cases, and in others it can be confusing. What it does is add (or modify) the ORDER BY clause of the SQL SELECT statement of the query.

There are cases where you really need the report to use your index tag(s), and you would want to then turn autoSort off in your report.

Large Tables
If you work with large tables in your reports, sometimes it takes a long time to make even the most simple changes -- this is because the designer is making these changes for each instance of the detailBand that is generated for the report (remember, the report designer works with live data).

To make this a bit quicker, you may find that you need to use a little-known feature -- the ability to only display a single row.

This can be done by right-clicking on the surface of the report, and in the popup menu, selecting "Report Designer Properties". In the dialog that appears, you can then select the "One Row" radio button in the middle of the dialog, and your report design can be sped up. Caveat: this affects all reports -- so once you have completed your changes, you may wish to go back and reset this property to "All Rows".

Navigating In Report Designer
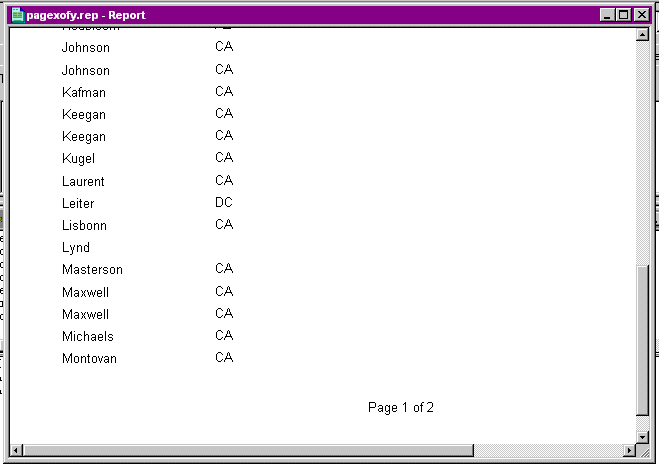
If you are dealing with a large report, it is helpful to view data on various pages. As it turns out, in the designer, you can see the next page by pressing the <PgDn> key on the keyboard, and to see the previous page, you can press the <PgUp> key.

Blank Fields
If you've worked with the report designer for any length of time, you will have noticed that if you have blank fields in the first few rows, but want to use those fields in the report, they don't appear -- which makes it difficult to manipulate them.

There are two simple solutions -- one is to add a "dummy" record that will always sort at the top of the table -- if your key field (the one you are indexing on) is numeric, set the value in this "dummy" record to 0, if it is character, set it to something that starts with a space, etc. The other fields in the "dummy record" should all contain data. Once you are done, you can then delete this record ...

The second solution is to use a "dummy" table -- one with the exact same layout as the real table, but in the designer you are working off this other table which contains data in all the fields ... once your report is designed, you can simply change the query's SQL statement to the real table.

Null Fields
This is related to the "Blank Fields" topic -- if you are using DBF7 tables, the BDE uses "true null" support. This means that a field that has not had a value entered into it contains a null value. This can be quite confusing when you try to generate a report, because the isblank() function is not going to return "true", but the field doesn't appear to contain a value. Note that empty() does return "true" in this case.

This isn't a real problem unless you are creating calculated fields in your reports that assume that there are values contained in the fields. If a null value is added to a character string, rather than getting the character plus the null value, you get simply a null value. This works for logical, numeric, date, and character fields ...

The solution to this problem is to check for the null value. The following is assuming your calculation is contained in the text property of the text control:

   {|| trim( ;
       iif( this.form.address1.rowset.fields["last name"].value ) == null, ;
            "", this.form.address1.rowset.fields["last name"].value ) ) +", "+;
       trim( ;
       iif( this.form.address1.rowset.fields["first name"].value ) == null, ;
            "", this.form.address1.rowset.fields["first name"].value ) ) }

Now, the above is a bit complex to store in the text property, and you may want to use the canRender event to do this instead (this is covered in the section of this paper that discusses calculated fields).

A more simple method of doing this is to pass the value of the field through the String class constructor (this converts nulls to empty strings), which has the added advantage of typing the long object reference only once:

   {|| trim( new String( ;
         this.form.address1.rowset.fields["last name"].value ) )+;
       ", "+;
      trim( new String( ;
         this.form.address1.rowset.fields["first name"].value ) ) }

Displaying Numeric Values
Sometimes getting numeric values to display just the way you want them can be a bit tricky. You should consider using the picture clause or the transform() function to make sure that your numeric values line up just right in your report.

For example, if you have data that must display two digits on the right of the decimal, but in one calculation or field you have a value that has zeros for the digits to the right, you may end up seeing an integer value appear.

If you set a picture clause, you can get the value to always display two digits on the right of the decimal (999.99, for example).

In addition, in some cases, you may want to display percent symbols and such -- you may want to use transform() (see online help for details) to get everything to line up.

Top/Menu

Enhancing the Appearance of Your Reports

Reports can be pretty bland, so sometimes it is desirable to enhance the appearance a bit to make parts of the report stand out, and/or just make it look better or easier to read.

There are a variety of things you can do to enhance your reports with very little effort:

These are just a few ideas to get you started. Of course, adding images or shapes to your report can also enhance them, as well as getting more fancy and using ActiveX controls ...

Top/Menu


Custom Reports and Controls

In order to speed your development time, it is a good thing to get used to the idea of using Custom Reports and Custom Controls with your reports.

A custom report is effectively a template for a report. The advantages to working with these include setting standards for all reports for a project, and setting properties that you commonly change in all your reports.

An example would be for a specific project, you need all your reports to have a specific logo and title text, and the customer wants all the margins to be a specific size.

If you set a custom report up with these properties and objects, then anytime the customer decides to change something (they might decide, for example at a later date, that the margins need to be changed again), you only have to change the margins for the custom report, and all of your reports that are derived from that report will be changed.

Custom controls allow you to do the same sort of thing for the fonts and other attributes of text controls -- one change in your custom control and all reports that use it will reflect that change. This is much easier than modifying every report you have created.

While the use of custom forms and custom controls may mean some initial work to get them exactly as you would like, you can save yourself many hours in the long run ....

The Custom Report GSPROD.CRP is used for many of the sample reports used for this paper. In addition, you should find the file CUSTREP.CC, which contains a set of custom text controls that can be used in reports ...

Custom Mailing Label Layouts
You cannot design your own custom labels in the same fashion as you can design custom reports as discussed above.

It is however, possible to create a new label definition that can be used by both the Label Wizard and the Label Designer.

The label definitions are stored in a table that is installed with Visual dBASE, in the directory ..\Designer\Label, the table for US customers is LABE0009.DB -- the number in the table name is what will be different if you're using a different language. You can add as many label definitions as you wish here -- however, there is a "catch" -- the table uses Double fields for dimensions, and by default these are shown without any decimal places.

It has been suggested that you create a form using the form wizard, and then set the picture property for most of the numeric fields (not the metric field, which is an integer value) to:

   9999.9999

The metric is the same as the metric property: 3 for inches, 4 for centimeters, etc.

A working version of this is in the file CUSTLABL.WFM.

You should read the header of the form carefully -- you may need to modify the path defined at the beginning of the form based on where you installed Visual dBASE 7. This form will let you view the labels currently in the table, and you can add or edit them (you may want to be careful editing label definitions that ship with the product ... or avoid it completely ... and just add your own ...).

Top/Menu


Handling Blank Lines/Suppressing When Printing

This seems straight-forward, but there are some tricks.

Reports evaluate in what is called 'z-order' (just like forms do); which means that the sequence that objects are defined in the source code file (.REP or .LAB for labels) can be important for certain aspects of a report.

What often happens when creating a report is that you get everything lined up and laid out exactly as you want, and then you add a field or text control somewhere to the report. This last object does not appear necessarily in the correct z-order, and this can cause your report to render differently than you might expect.

There is no layout option to change the z-order for reports as there is in the form designer, so any changes must be done by hand in your source code. (Cut/paste the necessary blocks of constructor code ...)

When creating a report that needs to have blank lines suppressed, follow these rules and you should be ok:

Example: For mailing labels you might have two address lines -- but in many cases the second one may be blank. Make sure all of your controls are in the proper z-order, and then check that the second address line (and any subsequent lines such as the city/state/zipcode line) has suppressIfBlank set to true and variableHeight set to false.

A working version of this is in the file BLANKS.REP.

VariableHeight text controls -- according to one of the developers:

The height that will be suppresed if a text control is blank is determined entirely by its height property. So if you have a variableHeight item with a height of 0, and it is suppressed when blank, nothing will change. However, if your variableHeight item had a height of 200 twips, then other controls would be moved up 200 twips.

Because it's more likely that a variableHeight item will have a very small (or even 0) height property, it may seem that suppressIfBlank works differently on variableHeight items, but it is really a function of the value of the height property.

Problem: Memos and large character fields, to print properly, must have their 'variableHeight' set to true. At this point in time, the only solution seems to be to print the memo before (z-order) any text that may need to be variable/suppressed ...

Top/Menu


Printing Single (current) Row from a form ...

It's a useful thing to be able to print an individual row from a table sometimes, but the report tools in Visual dBASE have built-in to them a specification that requires that the rowset always start at the first row (what is really happening is that the report generator creates its own query based on yours ...). There are at least three ways to get around this (this paper discusses three -- chances are that there are more).

Using a DataModule
The simplest method is to use a DataModule for both a form and the report (the same DataModule). When you place a DataModule onto a form or a report, there is a "shared" property, which if set to "All" will allow you to use the exact same settings from the form in the report (this also works between forms, but that's another topic altogether).

In your form, if you set a filter or a setRange() for a rowset and then call the report, the data displayed in the report should match that shown in the form.

A working version of this is in the file SINGLE1.WFM and SINGLE1.REP.

Overriding Events in the Report
The second (more complicated) is to override certain methods of the rowset, re-assign the query and rowsets of the report (you must assign the references in the report to your query and rowset to the one being used in the form), and then generate the report.

The following code is called from a pushbutton on a form:

      // save current setting for these events:
      fpOldFirst = form.rowset.first
      fpOldNext  = form.rowset.next

      // override these two methods:
      form.rowset.first := {; return true }
      form.rowset.next  := {; return false }

      // create instance of report (use your report name):
      set procedure to repone.rep additive
      // use name of report in constructor (CLASS ... OF REPORT)
      r = new reponeReport()

      // replace query in report (use your query names)
      // (these two just happen to be the same):
      r.customer1 := form.customer1 
      // assign rowset:
      r.streamsource1.rowset := r.customer1.rowset

      // render the report:
      r.render()

      // reset overridden methods:
      form.rowset.first := fpOldFirst
      form.rowset.next  := fpOldNext
A working version of this is in the file SINGLE2.WFM and SINGLE2.REP.

Modifying the Report's Code
The last option, while a bit of work in the report itself, may be more powerful in the long-run -- this is to store key field values into custom properties of the application, and in the report look for them -- if they exist, when the report is generated, you can set a filter or use setRange() (equivalent to the old Xbase DML's "set key") for your report's query ... For example, if you are working with a customer table, you might want to store the customer number, which would be unique for that row (if you have no unique fields, you might need to store more than one ...):

   // a button's onClick method:
   _app.CustNum = form.rowset.fields["customer id"].value
   do repone2.rep     // execute report
   _app.CustNum = null // get rid of custom property

In the report, you would need to set, probably for the query's onOpen event, code along these lines:

   // check to see if custom property exists:
   if type( '_app.CustNum' ) # "U" // it's defined ... ("U" is 'undefined')
      this.rowset.beginFilter()
      this.rowset.fields["customer id"].value = _app.CustNum
      this.rowset.applyFilter()
   endif
A working version of this is in the file SINGLE3.WFM and SINGLE3.REP.

Top/Menu


Landscape Printing

If you have tried to work with printing a report in landscape, you may have found some difficulties. (If you use the report wizard to generate a report, it will handle setting the properties shown below ...) Once you realize what is happening, it's not difficult, but ... here are some guidelines.

When you set the printer object's orientation, the report designer does not automatically re-set the pageTemplate and streamFrame's height and width properties. This means you need to set them yourself.

From here, you may want to do a bit of tinkering. For example, I generally set my margins (pageTemplate) to .5" all the way around, rather than the default of .75". In doing so, that adds a half-inch in both directions for printing surface, and so the streamFrame can be larger. Assuming the pageTemplate's margins are .5" for all four of them, you might want to set your streamFrame position properties to: Top = .65 (leave room for any headers you might want to print); Left = 0.25; Width = 9.25; Height = 6.5 (leave room for a page number at the bottom, or other text you may want to print there ...).

Once you have your settings, you might want to save this report layout as a template (just call it "my landscape template.rep" and then copy it if you need another landscape report) before moving on or you might want to create it as a custom report ...

Top/Menu


Multiple Columns

It is possible to have more than one column on a report page. The examples given will here will cover two columns in a report, however, you can have more than this -- the techniques given will work for more.

What is meant by column here? Normally when talking about data, columns refer to the fields in a table. What we're really talking about is having multiple streamFrames that are side-by-side on a report, and each streamFrame prints the exact same thing as the other (like a phone book listing, or a dictionary) ... each streamFrame could have multiple fields (data columns) in it ....

First, you need to have some idea how big your columns need to be. There should be at least a bit of room between columns -- the amount of spacing you leave between them is up to you, but without any spacing your report may get hard to read. The columns will need to fit on your pageTemplate (between the margins). Set your metrics to inches ... Once that is done, look at your margins (default margins are .75" on all four sides -- I often reduce that to .5", which gives a bit more printing area).

Determine how much space you want between your columns. Subtract the pageTemplate's left and right margins from the width of the report -- an example would be a standard piece of paper (in America) of 8.5" wide, if my left and right margins are .5" each, this means that my pageTemplate will allow me to print on 7.5" of the page. Next, subtract the amount of space between columns. You might want only a quarter inch -- so for our example, we will use this value. 7.5" - .25" gives us 7.25". Finally, how close to the margins do you want to be? You could put your columns right up against the edge of the pageTemplate (this is acceptable), or you might want some more white space. If you want to use all of the available pageTemplate (recommended), you don't have to do anything else, otherwise determine how much space you need and subtract that value twice from what you currently have. Divide that value by 2 to get the width you need for your columns. This will give us 3.63" per column.

The calculation would look something like the following:

      (Width of paper)                                 8.5"
    - pageTemplate.marginLeft                           .5"
    - pageTemplate.marginRight                          .5"
    - (# of columns - 1) * (space between columns)    ( 2 - 1 ) * .25 = .25
    ----------------------------------------------    ---------------------
    SubTotal (space left)                              7.25
    Divide by # of columns                             7.25/2
    ----------------------                            -------
    Column width                                       3.63" per column
(Note: The above calculation does not take into account whether you are leaving space on the pageTemplate on the left and/or right sides of the columns ... instead, it assumes you want your streamFrames to be right up to the edges of the pageTemplate.)

Columns on a report are really just multiple streamFrames. Your report defaults to having a single streamFrame, so you should start by setting the width of the first one to 3.63" (based on the calculation above). For this example we are putting the columns up against the edge of the pageTemplate, so set the LEFT property to 0.

NOTE: Due to the nature of custom reports (the fact that only some of the controls are streamed out to derived reports) trying to use a custom report for this is difficult at best. For the example, I am using a copy of a template report based on the custom report ...

Now you have two options -- the first is to copy the current streamFrame, or you can simply drop a new streamFrame onto the report from the control palette. Since you have already set the width for the current streamFrame, I recommend using the windows copy and paste (Ctrl+C and Ctrl+V) to add your second streamFrame to the report surface. Set the top property of streamFrame2 to the same value as that of streamFrame1; set the left property to 3.63 plus the amount of space you wish to have between columns (.25" is what we determined above) -- or 3.88. You now have two columns!

Place a field onto the detailBand in the first streamFrame where you want it to be printed. If you used my suggestion above to copy/paste a copy of the first streamFrame, however the field isn't in the second column automatically. Click on the second streamFrame, and in the inspector, notice that there is a streamSource property, which shows "null". Click on this, and select STREAMSOURCE1. NOW you should see your data in both columns!

There is another option for placing multiple streamFrames on a report, and this is to select the streamFrame object from the component palette, and drag/drop a new streamFrame to the report. The one advantage to doing this is that the streamSource property defaults to the main streamSource for the report. The disadvantage is that you then have to set all the position properties ...

A working version of this is in the file MULTCOL.REP.

Top/Menu


Calculated Fields

Calculated fields can be done in a report in several ways, and we'll look at some of them here.

Using a DataModule or Query
First, there is the data module -- if you are not using these, you should consider them. Datamodules are designed to replace the Visual dBASE 5.x query (.QBE) file, and can be used to open multiple tables, set relationships, and more. In a dataModule you can design calculated fields for use in reports (or in forms) fairly easily. This is done with the Field class, and usually in the onOpen for a specific query object placed on a dataModule.

Using the CUSTOMER table in the ..\VISUAL DBASE\SAMPLES\MUGS\TABLES directory, an example would be to create a calculated field that combines the first and last names of a customer into a single name field -- follow these steps:

In the navigator, click on the dataModule tab. Double-click the first "Untitled" icon (the second is for custom datamodules, which is another subject completely ...). This will allow you to design a datamodule (if the dialog appears asking about using the wizard, click on 'Designer').

The designer (if you are not familiar with datamodules) looks like the form designer, except that the component palette is limited to just database objects. Click on the navigator again, and drag the customer table to the surface of the datamodule. This will give a small image that has the letters 'SQL' on it (the standard 'query object' in Visual dBASE 7).

In the inspector, click on Rowset, and then the 'I' button. Select indexName, and in the drop-down select 'Last'. This is just so that we know the report will be indexed properly. Click on 'Parent' in the inspector, and then the 'I' button. This will take us back to the query object. Note that you can also click on the "Back" button on the inspector to go back to the query object.

The next thing we're going to do is create a calculated field. This requires a small amount of coding, which will be written into the onOpen event of the query object (meaning that when the query is opened, we will execute the code). In the inspector, click on the "Events" tab, and then on the onOpen event. Click the 'tool' button, and the editor opens. In the editor, enter the following:

   f = new Field()
   f.fieldName = "FullName"
   f.beforeGetValue = {|| trim( this.parent["first name"].value ) + " " + ;
                          this.parent["last name"].value }
   this.rowset.fields.add( f )

Save your datamodule and exit the designer.

Once you have created your data module, you can then use it in a report (or a form) easily. To see this in action, create a new report, and drag this new dataModule onto the report. (The report designer automatically will set the references necessary to use the table(s) on your report.)

If the field palette is not on screen, open it up (right click on the report surface ...). Notice in the field palette that in addition to the other fields in the table, your new field is at the bottom. If you drag that onto the streamFrame, you should see this repeated for each row in the table.

If you do not wish to use a dataModule, you can do the exact same steps as above with the difference being that you drag your table onto the surface of the report, and then create the calculated field in the query's onOpen as shown above.

A working version of this is in the file CALCFLD.DMD and CALCFLD1.REP.

Using the Text Property (Codeblocks)
There are other ways to do calculated fields in reports, however. As a matter of fact, the default text control on a report that displays the contents of a field is usually a calculation, done with a codeblock. The calculation is performed for each row, obtaining a new value from the field. An example of what this looks like is:

   {||this.form.customer1.rowset.fields["First Name"].value}

If you wanted to, you could modify this codeblock. For example, rather than printing just the first name, you could print the full name, in a similar fashion to what we did previously:

   {|| trim( this.form.customer1.rowset.fields["First Name"].value ) + " " + ;
       this.form.customer1.rowset.fields["Last Name"].value }

This can get a bit tricky, especially with a long calculation, but it is do-able.

A working version of this is in the file CALCFLD2.REP.

Using the CanRender Event
Another useful way to do the same sort of thing, and it's even better for some complex calculations, is to do this in the canRender event for an individual text control. One relatively simple version of this is to place the city, state, zipcode, and country information into one text control. To do this, drag the CITY field onto the streamFrame of the report. You might want to change the name of the text control, but it isn't necessary. In the canRender event (click on the events tab, and select canRender, select the tool button, so you get the editor), do something along these lines:

   rMyRow = this.form.customer1.rowset  // shorten the object reference
   cCity = trim( rMyRow.fields["CITY"].value )
   cState = trim( rMyRow.fields["STATE"].value )
   cZip = trim( rMyRow.fields["ZIP"].value )
   cCountry = trim( rMyRow.fields["COUNTRY"].value )
   // assumes that there is information in the first three fields:
   this.text = cCity + ", " + cState + "  " + cZip
   if not empty( cCountry )
      this.text += "  <B>"+cCountry+"</B>" // bold 
   endif
   RETURN TRUE // this is usually added by the report designer

A working version of this is in the file CALCFLD3.REP.

Notice that all of the above can be used with numeric, date and logical values (including combining types) as well as character (this is due to the automatic type conversion feature of Visual dBASE 7).

Referencing A Codeblock/Calculated Field
One of the trickier things involved in working with calculated fields that are codeblocks is that if you wish to reference the values for these in other calculations, you may find yourself referring to the text property (which is not the value you are looking for), rather than the value. The solution is to force a re-calculation, by adding parentheses to the text property in the reference, i.e.,;

   this.parent.textcontrolName.text() // in the same band

The parentheses act as the call operator, which executes the codeblock.

One example would be to change the value of a text control elsewhere in a report to the value of the current text control:

    function MyText_canRender // the name of the function will vary
       form.pageTemplate1.text3.text := this.text()
    return true

Top/Menu


CheckBoxes for Logical Fields

With Visual dBASE 7, we can now display checkboxes in a grid, but we can't do it in a report. Or can we? Actually, it isn't too difficult, and the example given here could be modified to just about any character(s) in any specific font set.

In order to get checkboxes, we must use a Windows font that has the characters we want to use, and we need to know where those characters are in the character set, and finally check to see if we can get those characters with the language drivers we have set for the BDE.

If you are using an ANSI language driver in the BDE for your native DBASE table driver (if you are not sure, bring up the BDE Administrator; make sure you are on the "Configuration" page; select "Drivers"; select "Native"; select "DBASE"; look at "LANGDRIVER" -- the default is "WEurope ANSI") -- this is what Windows normally uses (ANSI, anyway), and the chances are that the following will work. If not, try setting your DBASE driver to "WEurope ANSI".

BDE Configuration

If you want to display a logical field on your report with a checkbox that changes to checked if the value is true, and empty if the value is false, you need to place a text control onto the report, and then try the following:

If you want to use a different font, make sure that it is one that is installed with the operating system, or that you have the rights to distribute it -- many fonts are shareware and require fees from the developers.

A handy report for viewing what characters are assigned to what in any font is in the file CHARACTR.REP (using table CHARACTR.DBF).

If you want other characters, you need to know what the characters are mapped to. You can change the font by changing it for the one text control. The report defaults to using Wingdings, so you can display (or even print) these characters, and make a decision from there.

Top/Menu


Groups and Summaries

The following is by one of the developers who wrote the Report Designer, and may help understand groups in a Visual dBASE 7 report:
Groups are added to the streamSource. Groups have a groupBy property, a value used to determine where groups should break. At the beginning of each group, a headerBand is rendered. At the end of each group, a footerBand is rendered. Groups have various methods that are used as aggregate functions, such as Count, Sum, Max, etc.

By default, when you assign a value to the groupBy property, the query's SQL statement is changed to contain an ORDER BY clause with the groupBy field. This will ensure that the groups break correctly when the report is rendered. Setting the report's autoSort property to false can turn off this behavior. Do this if you know the rowset is already in the right order, and/or you want to do groups on calculated fields (see the groupBy example on page 17-25 of the Language Reference).

The report itself has a built-in group object, called the reportGroup object. The headerBand of this group is rendered at the very beginning of the report, and the footerBand is rendered at the very end. Its aggregate methods are used for performing aggregates on the entire rowset.

Sorting The Data
One of the problems that sometimes comes up, especially with multi-table reports that are grouped is getting the data to sort properly. The online help discusses this, but to re-iterate:
If a report object's autosort property is set to true (the default), then the SQL property of any query that is accessed by a streamSource object that has groups will be modified automatically to include an ORDER BY clause that sorts the rowset in the correct order.

For example, if you have two Group objects, the first grouping by the field STATE and the second by ZIP, then even if the query's SQL property is set as:

      select * from SALES
   

The rowset will be generated internally with the SQL statement:

      select * from SALES order by STATE,ZIP
   

(NOTE: This is streamed out to the query object's SQL statement this way ...)

If autosort is false, the rowset is not altered by the report engine. It assumes that the query is correct and contains the necessary fields in the right order. Therefore, if you use the indexName property to set the rowset order, you should set the report's autoSort to false; otherwise it defeats the purpose of using indexName.

Below are some ideas that may be useful ...

Page Totals
If you are already grouping your report, you may find that there are totals you would like to place at the bottom of the page. Neat idea. However, there is no way to hook directly into the internal mechanism that fires for groups in reports. You can, however, get around this by using the preRender or onRender events that are attached to the groupHeader (or groupFooter) band. By placing specific calculations there, you can then print the results somewhere else.

For example, using the customer table, if you have the table grouped by state you might want to print the number of states on that page; and perhaps keep a running total for the whole report while you were at it.

This means setting up two variables, incrementing them when the group changes, and setting one to zero (the page total) when the page changes.

The first part is pretty easy -- using a control that will always be evaluated before anything else -- the query (or datamodule), you can work with the onOpen event (the report object does not have an 'onOpen' or a 'preRender' event):

  form.nPageTotal=0 // Yes, you can use a form reference in 
  form.nRepTotal=0  // the query's onOpen event

There needs to be a way to increment your totals when a group changes. You can cause this to fire in the group headerBand or footerBand's preRender or onRender event:

   // because the 'form' reference isn't available here:
   f = this.parent.parent.parent
   f.nPageTotal++
   f.nRepTotal++

When the page changes you need to reset the value in form.nPageTotal. This can be done with the report's onPage event -- this fires after a page is done rendering, so it is the perfect place to reset form.nPageTotal. To get to this event, in the inspector go to 'form'. Click the onPage event, click the tool button, and enter:

   form.nPageTotal=0

Finally, you will want to actually print these values. Place a text control on the pageTemplate under the streamFrame for the page total, set the text to:

   {|| "Total States on this page: "+form.nPageTotal }

NOTE: If you get an error here that states "nPageTotal" does not exist, everything is ok -- save the report and exit the designer -- when you return to the designer, this value will have been initialized, and you will be fine.

And the report total would be placed in a similar place, only refer to the appropriate variable.

One question that might come up is, "what if you only want the report total to print on the last page?"

The solution is to use the canRender event for that particular text control, and in the canRender event, check to see if you are currently on the last page. The report itself has a method to let you know: isLastPage() -- which returns a value of 'true' if this is the last page, otherwise it returns 'false'. In the canRender event of this text control, set the following codeblock (in the inspector):

   {|| form.isLastPage() }  

With this codeblock set, when the report is run this text control will only appear on the last page of the report.

Note: It is possible to place a report total on the last page of the report by using the report's footerBand -- a lot depends on what you want your report to look like.

A working version of this is in the file PAGETOT.REP (using table CUSTOMER.DBF).

Aggregate Functions
The report designer has a set of aggregate functions available for use in reports that can be used to handle some calculations for you. These include totals, averages, minimum, maximum, and so on. More details can be found in the online help using "aggregate calculations (reports)" for your keyword. You can insert these into your report with the group dialog called from the menu ... (or you can add them yourself -- you may want to try using the Report Wizard once to see how the code gets defined before trying this on your own ...).

Running Totals
Running Totals can be done in a variety of methods, depending on your needs.

The important thing to remember about these is determining where you need to increment values that you wish to print, and where you wish to print them.

If you wish to simply add values as you print them in the detailBand, you may wish to consider using the aggregate function SUM() noted above. If, however, you wish to work with groups, you would need to do something along the following lines:

In the group footerBand's or the detailBand's preRender event you would want to first check to see if the total you wish to use exists:

   if type( "this.myTotal" ) = "U" // does not exist
      this.myTotal = 0             // initialize it
   endif

Once you have done this, all you would need to do is add the code to add to the total:

   this.myTotal += form.streamSource1.rowset.fields["myField"].value

In your report's detailBand or the group's footerBand, you could then print the value of "myTotal" by referring to it appropriately -- you would need to create a text control, place it on where you want to print it, and then either set its text property to a codeblock or use the canRender event to refer to:

   // In a canrender:
   this.text = form.streamSource1.footerBand1.myTotal
   RETURN TRUE
A working version of this is in the file RUNTOT.REP (using table INVENTORY.DBF).

Top/Menu


Multiple Tables

The report designer is designed to let you work with related tables easily. However it does take a bit of setting up, and you will most likely need to do a grouped report (using the primary or parent table, or a key field from the same, for the main group).

Note -- if you need to use a complex index for a group or for the detailBand, you should make sure that the report's autoSort property is set to false (see section of this paper on groups above), and use the indexName property for the appropriate rowset to use that index tag ...

To create a report using linked tables, you should follow these steps:

If you need to, you can do nested groups and so on. It is a good idea for a grouped report to have a layout already in mind, as these can get confusing fast. If you place a second group onto a report, it will be the "outer" group, which may not be what you need or want.

In some cases, it may be easier to let the Wizard do the initial layout, and then you can come in and modify the report to your heart's desire ...

Top/Menu


Force Report to New StreamFrame (or Page)

In some reports, it is desirable to force your report to start printing on a new page at some point -- for example, if you are doing a grouped report, and you are near the bottom of the page, you may not want the groupHeader to print by itself at the bottom, but instead, go to the top of the next page (or streamFrame).

This can be accomplished by using a combination of a property of the band (the groupHeaderBand, groupFooterBand, or detailBand) called renderOffset and the streamSource method beginNewFrame() (this is not to be confused with the beginNewFrame property of the band object).

In order for it to work, you need to have some idea how much room you need to print a minimum of the group headerBand and a row in the detailBand, as well as the height property of the streamFrame. The height of the streamFrame is easy, and the renderOffset property (which is read-only) returns the distance from the bottom of the band to the top of the streamFrame. So, if you know that your report requires at least a half-inch in order to print the group headerBand and at least one detailBand, you could force a new page or streamFrame with something like the code shown below (after the discussion of groupFooterBands).

If you do not have a groupFooterBand, use the detailBand, otherwise, use the groupFooterBand, and check the following (in the onRender event):

   // in a detailBand:
   if ( this.streamFrame.height - this.renderOffset ) < .5 // 1/2" 
      this.parent.beginNewFrame()
   endif
In a group footerBand you would need to check the level of "parent" -- there is one more layer there ... so "this.parent.beginNewFrame()" would become "this.parent.parent.beginNewFrame()".

Forcing a New Page with Multiple Columns (Phone Book Example)
Another example of forcing your report to a new streamFrame or new page would be an example based on a question that was posted on the Compuserve VDBASE forum by a user -- he was creating a phone book listing for a series of apartment buildings, which was done in three columns. He needed the ability to change to a new page when the apartment building changes.

For this example, we will use an "Apartment" table (which is not one of the sample tables -- it is a quick table thrown together for this example, and has data copied from other sources, and repeats a lot). When setting up the report, set the indexName to the "BLDNAME" ... Place the name and phone number fields onto the streamFrame's detailBand.

Place a group on the report, and set the groupBy property to the "Apartment Building" field. While you are in the inspector, set the headerEveryFrame property to true (otherwise it will not print on new pages ...). Go to the headerBand object in the inspector, and set the beginNewFrame property to true. You should change the text value of the text property that is automatically placed on the group's headerBand to something like:

   "Apartment Building "+this.form.apartmnt1.rowset.fields["Apartment Building"].value

We will use the groupFooterBand to print a simple text control to show the end of the current apartment building entries. This should have text like "** End of Apartment Building".

Next, set up the streamFrames -- we need three for this example (suggest width of 2.45 inches).

Now that the report itself is laid out, we get to the more involved code part -- adding code that will make sure that each apartment building starts on its own page.

We will use the group's footerBand to force the printing of the next group to the next page by checking to see which streamFrame we are printing in. If we are not in streamFrame3 (the last streamFrame on the page), we need to force the report to the next page. To do this, set the onRender event for the group's footerBand to:

   // do something with streamFrame property
   if this.streamFrame.name # "STREAMFRAME3" // last streamFrame on page
      // set a flag (check it in streamFrame's canRender):
      this.parent.parent.parent.NextPage = true
   endif

The reason we check for streamFrame3 is that if we are on this streamFrame, we will automatically jump to the next page. We need to see if we're NOT on that streamFrame.

Next, we must set a canRender event for streamFrames (2 and 3). For streamFrame2, set the following:

   // is the flag true? If so,
   if this.parent.parent.NextPage
      // go to the next frame ... (well, since we're doing
      // this twice, we really want to go to the next page)
      this.parent.parent.streamSource1.beginNewFrame()
   endif

To be sure that this event fires also for streamFrame3, all you have to do is click the "Method" menu, and Link, and link the streamFrame3 canRender event to this same event.

Finally, you want to be sure that this flag does not remain 'true' for the duration of the report -- otherwise you would only ever print in the first streamFrame (or column) -- and never get to the other two, after the flag was set to true the first time. So, in the onRender event of the group's headerBand, set this simple bit of code:

   // once it's been rendered, we don't want to
   // force this again:
   this.parent.parent.parent.nextPage = false

As with any report, there are probably a variety of things you would want to do to clean this up and make it look better. This should give you some idea of how to force a new page, however ...

A working version of this is in the file APARTMNT.REP (using table APARTMNT.DBF).

Skipping n Labels
It has been pointed out that one of the frustrating aspects of printing labels is that the last sheet of labels often has some blank ones left on it, and they are being "wasted.".


Before going on, a brief warning: Most printers and/or labels warn that it is a bad idea to re-use a sheet of labels, once they've been run through the printer. If you have never had to deal with a label stuck on the drum of a laser printer, you don't know how difficult it is to clean ...
Now that you've been warned ... basically, using techniques already discussed in this section of the paper, it is possible to set the canRender event for individual streamFrames (each label is a streamFrame on a pageTemplate) so that if it is one you wish to skip printing on (because the label at that position has been used) you can ...

You would need to create a program that looped through the streamFrames on your report (labels), and set the canRender event to force a call to the streamSource's beginNewFrame() method.

However -- if you are not paying attention -- you will skip those streamFrames for every sheet of your labels, which is probably not what you want. You need to check to see which reportPage you are on.

The pertinent code from the program on the conference CD "SKIPLABL.PRG" is:

   p = rMyLab.pageTemplate1 // shorten references

   // Loop through the streamFrames ...
   for i = 1 to nSkipLabels
       cEvent = "p.streamFrame"+i+".canRender"
       // the event must be set ONLY for the first page -- otherwise
       // we will skip this streamFrame for all pages ...:
       &cEvent. = {; iif( this.parent.parent.reportPage = 1, ;
                  this.parent.parent.streamSource1.beginNewFrame(), null ) }
   next
   
   rMyLab.render()

A working version of this is in the file SKIPLABL.PRG. (This needs to be used with your own label (.LAB) file)

Top/Menu


Cover Page

Attempting to create a cover page for a report is a bit tricky, but it can be done. There are two different ways to do this and good reasons to use either method.

Cover Pages Using the Report's headerBand
The simple method of creating a report with a cover page is to use the report's headerBand, combined with the streamSource's beginNewFrame() event.

The report's reportGroup headerBand only prints once -- at the beginning of a report.

To use this method, start creating a report as you normally would. Once you have a basic layout, in the inspector, select the report's reportGroup headerBand. Set the height property to some large value, say, 5 inches. Place what you need to appear on the headerBand -- text, images, even data from a secondary table can be placed here -- as long as you are not intending to process multiple rows of the secondary table.

Next, in the onRender event for the reportGroup's headerBand, set the following code:

     // Set StreamSource's beginNewFrame() event:
     this.parent.parent.streamSource1.beginNewFrame()     

This is a nice and easy way to do the coverPage -- the only drawback is that any controls that you have on the pageTemplate will also display on the same page as the reportGroup's headerBand.

One way to avoid this is to simply use the canRender event for any controls that you do not wish to print on subsequent pages and check to see if the current page number is 1, and return "true", otherwise return "false":

   function MyText1_canRender
   return iif( this.parent.parent.reportPage == 1, true, false )

Another way to avoid this (if you want to) is to use the next method shown in this paper -- multiple pageTemplates.

A working version of this is in the file COVPAGE1.REP (using the CUSTOMER table).

Cover Pages Using Multiple pageTemplates
The second method of creating a cover page requires that you design a report with multiple pageTemplates, which cannot be done directly via the designer (but once you have done some setup, the designer does recognize the two pageTemplates).

To understand what needs to be done -- you must set up a report that has two pageTemplates -- the first will be your cover page, the second will be what is used for the rest of the report. In order to do this, you will need to go into the source code for your report, and copy some of the code, and make some other changes to the code so that the report engine will know how to process it. You can then set some text controls and/or images (useful for logos) on your cover page. Finally, you need to set for one of the text controls some code that will tell the report engine to start the next BAND to print (groupHeaderBand or detailBand ...) on the next streamFrame (which is on the next pageTemplate).

NOTE: Due to the nature of custom reports, some properties are not streamed out, such as the pageTemplate -- hence you will have to do this without using a custom report. The sample report (on the Conference CD) uses a copy of a report that was copied from the custom report normally used for reports for this paper, called GSPTEMP.REP. This template has the same properties as the custom report, but has all the properties streamed out.

Step-by-Step:

A working version of this is in the file COVPAGE2 (using data from the CUSTOMER table).

Page Numbering
If you use the custom control that ships with Visual dBASE to display the current page number on your report, you will find that the first page of the report with actual data on it starts at page 2. If you want your report to start with page 1 on the first page of data (i.e., not the cover page), then the solution is to remove the custom control, and simply place a text control on the report, with the text property being set to:

 
   {|| form.reportPage - 1 }

And of course, set the fonts and fontsizes and such appropriately.

Changing the Paper Tray
One last item that might be useful -- I got a lot of ideas from users for this paper, and one user asked about changing the paperTray as the report is printing.

You might want to use a company letterhead for the cover page, and plain paper for the rest of the report.

In the onPage event for the report, check the reportPage value:

   if form.reportPage == 1 // page that just printed
      form.printer.paperSource = 15 // you will need to check this
                                    // for each printer you are using 
                                    // on my Laserjet 4 at work, 1 = Upper tray
                                    // and 2 = lower tray
   endif

In addition, you would need to set the paperSource for the coverPage in the printer object as the default paperSource for the report, since the first page to print is the cover page.

Top/Menu


Binding/Printing Offsets

Method 1 (Multiple pageTemplates)
Looking at the onLine help for Visual dBASE, I stumbled across an idea that made a certain amount of sense. If you print some reports up and have them copied, you might want to have your margins alternate a bit for binding purposes (binding offsets). This looks like it ought to be difficult, but ... by using two pageTemplates, you can do it easily. (See below for a different method as well ...)

First, create a new report. Place your table(s)/dataModule(s) on the report. Set your pageTemplate's left margin to a larger value than the right margin (shifting the page over to the right tad) -- example, use .75" for the left, and .5" for the right (or you could get more dramatic and use .25" for the right!). Place a couple of fields onto the streamFrame, so that you can see some text in the report, and then save it.

Bring up the source code in the editor. You will need to copy the pageTemplate definitions, and make some other minor changes to your report:

Copy these two blocks of code, and change the name to PAGETEMPLATE2 wherever it appears as PAGETEMPLATE1 below (this is similar to what was discussed in the Cover Page part of this paper above, but is not exactly the same):

   this.PAGETEMPLATE1 = new PAGETEMPLATE(this)
   with (this.PAGETEMPLATE1)
      height = 11
      width = 8.5
      marginTop = 0.75
      marginLeft = 0.75
      marginBottom = 0.75
      marginRight = 0.5
      gridLineWidth = 0
   endwith

   this.PAGETEMPLATE1.STREAMFRAME1 = new STREAMFRAME(this.PAGETEMPLATE1)
   with (this.PAGETEMPLATE1.STREAMFRAME1)
      height = 8.0521
      left = 0.25
      top = 0.9479
      width = 6.5
      form.STREAMFRAME1 = form.pagetemplate1.streamframe1
   endwith

Next, change the marginLeft and marginRight values (shown above -- reverse them).

Copy all controls that are on the first pageTemplate (directly) as well, and change the pageTemplate1 references in the copies to pageTemplate2 (or you won't have any headings at the top (or bottom) of your report on one pageTemplate).

Finally, go to the bottom of the code, and find these lines:

   this.firstPageTemplate = this.form.pagetemplate1
   this.form.pagetemplate1.nextPageTemplate = this.form.pagetemplate1
   this.form.pagetemplate1.streamframe1.streamSource = this.form.STREAMSOURCE1

Change the second statement to read:

   this.form.pagetemplate1.nextPageTemplate = this.form.pagetemplate2

Copy this statement and make the copy read:

   this.form.pagetemplate2.nextPageTemplate = this.form.pagetemplate1

The two pageTemplates are now referring to each other -- pageTemplate1 will execute for odd number pages, and pageTemplate2 will execute for even number pages, giving you the offset you need for binding. However, you still need to assign a streamSource for the second pageTemplate, so copy the third statement in the original code above, and make it read:

   this.form.pagetemplate2.streamframe1.streamSource = this.form.STREAMSOURCE1

So when you're done, that last section of code should look like:

   this.firstPageTemplate = this.form.pagetemplate1
   this.form.pagetemplate1.nextPageTemplate = this.form.pagetemplate2
   this.form.pagetemplate2.nextPageTemplate = this.form.pagetemplate1
   this.form.pagetemplate1.streamframe1.streamSource = this.form.STREAMSOURCE1
   this.form.pagetemplate2.streamframe1.streamSource = this.form.STREAMSOURCE1
   this.form.STREAMSOURCE1.rowset = this.form.customer1.rowset

When you go back into the designer, if you got all the changes correct, it should now reflect this, and if you generate a report based on this, you will see the page offset take effect. (Actually, you should also see it in the designer ...)

A working version of this is in the file BINDOFF1 (using data from the CUSTOMER table).

Method 2 (Custom Text Control)
This method may actually be more simple than above. The main reason I would use the version above is so that you could set headers and footers for each pageTemplate that were more complicated than simple text changes (for example, alternating page numbers and/or report titles on the left/right like you might find in a book) ... You can do the same with this method, by changing the text of the text objects when you change the pageTemplate's margins. So, you might want to do the binding offsets shown in the first method only if your pageTemplates are very different ...

This method uses a text control's text property (which is evaluated each time it is rendered) to change properties of the pageTemplate, and in addition, you could change a text control's text itself at the same time ...

You can do this by creating a custom control, or by simply placing a text control onto the report, and in the source code, making the TEXT property point to a method of the report:

   text = class::updatethistext

This function would then look like:

function updatethistext
      nPageNo = this.form.reportPage
      if mod( nPageNo, 2 ) == 0 // even number
         form.pageTemplate1.marginLeft := .25
         form.pageTemplate1.marginRight := .75
         cText = "Even number pages"
      else
         form.pageTemplate1.marginLeft := .75
         form.pageTemplate1.marginRight := .25
         cText = "Odd number pages"
      endif
return ( cText )

One thing I noticed is that the designer sometimes evaluates a text control's "text" event and saves it, so you might want to add the following to be sure that this does not occur (otherwise the event will not execute):

      onOpen = {; this.text = class::updatethistext }

A working report showing this is in the file BINDOFF2 (using data from the CUSTOMER table). The custom control BINDING.CC is also provided. Read the header carefully to make sure you understand what it's doing.

Top/Menu


Changing Report and Control Properties Programmatically

One of the nicest parts of the report tools in Visual dBASE 7 is that they generate two-way code -- meaning that you can work on a report in the designer, the editor, or both -- and any changes made will be reflected either way. This also means that the report itself is dBASE code.

What all this boils down to is that when you run a report, you can actually change properties of the report, the database objects used by the report, and/or the visual (and non-visual) controls of the report itself, before actually rendering the report.

This gives you a lot of power. I have found in several of my reports and labels that I didn't have to have multiple copies of the same report with minor changes to them like I used to in Crystal Reports -- I can have a single report, and before I render it, I can change just about anything -- as long as I know how to get to the specific control or property I need to change.

The important part of this is that you have to create an instance of your report, but do not render it ... this means that you cannot simply issue the command:

   do myrep.rep

At least, not if you wish to retain some control ... what you can do is to create an instance of the report, and make changes to your properties, and then render it:

   set procedure to myrep.rep additive
   rMyRep = new MyRepReport() // class name in report file
   // change properties as needed here
   // we'll look at this in more detail ...
   rMyRep.render()            // this is how we actually generate the report

What kinds of things can we do here? Let's examine the possibilities:

Top/Menu


Page X of Y

Many folk have asked for the ability to generate a text value that shows the current page number, and the total number of pages in the report. The question is, how does the report generator know how many pages there are? If you're working with a table, this value is variable -- more records get added, some may get deleted, and so on. It makes it rather difficult to store that information somewhere.

The difficulty only lies in any report where the height of the detailBand is variable. If your detailBand is fixed, so that, say, you always display 50 rows per page, you could actually calculate the number of pages and bypass the following code.

Otherwise, if your detailBand is variable in height, the only method of getting the total number of pages is to do what is called a "two-pass" report. The technique shown might be used for other situations, but was specifically designed for this one.

Basically, you need a custom text control that will generate the report to a temporary file, so that you can obtain the number of pages in the report. In order to do that, you must use the onOpen event of a text control. Here's the basic definition, and the code will be examined in detail:

class PageXofY( parentObj ) of Text( parentObj ) custom
   with ( this )
      height      := 1
      metric      := 0
      text        := class::GetPageNum
      OnOpen      := class::GetLastPage
  endwith

After the definition of the events used we will see the endClass statement (necessary for any custom control). Notice that the onOpen event is set to execute an event called "GetLastPage" -- when the report is opened (run, displayed in a reportViewer, displayed in the project manager, etc.) the code in this event will fire. This code looks like:

  PROCEDURE GetLastPage
      // check to see if this has been set:
      if type( "this.dontLoopOnMe" ) # "U"
         return
      endif

We'll come back to the 'dontLoopOnMe' bits. It's a touch complicated.

      // have to create an instance of the report:
      cReportName = this.form.className
      rRep = new &cReportName.() // new instance of report

Here we have just created a new instance of the report -- this way we can change some of the properties and events, without affecting the actual report.

  // Have to assume "pageTemplate1" as well as "PageXofY1"
      if type( 'rRep.pageTemplate1.PageXofY1' ) == "O"
         rRep.pageTemplate1.PageXofY1.dontLoopOnMe = true
      endif

Again, we'll come back to a discussion of this code ...

      // Make some changes:
      rRep.startPage      := 1              // we want all 
      rRep.endPage        := -1             //     pages
      cOutPut             = fUnique( "temp????.prn" ) // unique filename
      rRep.outPutFileName := cOutPut        // to temp file
      rRep.outPut         := 2              // printer file   
      nLastPage           = 0               // set counter
      rRep.onPage         := {|| nLastPage++ } // increment for each page

The changes made in this instance of the report are important. The startPage and endPage are just to ensure we get the whole report (although if a filter is set, it will take effect here as well). Notice that we set an "outPutFileName" property, so that we're outputting to a printer file, and then set the "outPut" property to that. Next we create a counter, and then override the "onPage" event with a codeblock (the last statement in the code above) -- in this case, we are incrementing the counter for each page printed.

      // Render the report
      rRep.render()

Render the report to the temporary file.

      // Now we're done with this copy of the 
      // report, release it:
      rRep.release()

Release this instance of the report, as it is no longer necessary.

      // done -- cleanup
      erase &cOutPut

Erase the temporary file.

      // This is what it's all about!
      this.LastPage = nLastPage

Save the value in the counter to a property of the text object ("this" refers to the text control at this point in time).

So, we have the last page number. How do we actually display this information on the report? In the constructor code of this control is the statement:

      text        := class::GetPageNum

This tells dBASE that every time we want to display this control, we must execute the code in the event GetPageNum, which is shown below (this code is based on the code in REPORT.CC which ships with Visual dBASE for the pageNumber text control):

  PROCEDURE GetPageNum
      local nPage
      nPage = 0
      if TYPE("this.form.reportPage") == "N" 
         nPage := this.form.reportPage
      endif

      if TYPE( "this.LastPage" ) == "U" or this.LastPage = 0
         this.LastPage = 9999
      endif

This small bit of code (above) is here to make sure that we have a last page number to display when designing the report. I purposefully gave a large value (9999) just to be sure there's enough room when laying out the report ...

      return ( "Page "+nPage+" of "+this.LastPage )

The value displayed is what is shown above -- notice we are combining numeric values and text ...

Now, back to that "dontLoopOnMe" bit -- why is that there? This code is designed to create an instance of the report that we want to print, and render it. When we Render the report, dBase executes the onOpen event for this control. If we aren't careful, we could end up in an awful loop, because the onOpen event renders the report, which executes that onOpen event, which renders the report ... What this code must do is create a small flag that says "don't do that!" -- or more explicitly, "only do that one time!". So, in the primary instance of the report (the first time the report is rendered), we look to see if a special flag is set (dontLoopOnMe). If it is not set, then we want to execute the onOpen event. The onOpen event then generates a clone of the report (a new instance of it), but ... in that instance of the report, we do NOT want to re-execute the code in the onOpen event. So, we find the control, and create the flag (dontLoopOnMe). That way, when we render the report to the temporary file, the report will come across the check at the beginning of the event that says that if the flag exists, RETURN, rather than executing the rest of the event.

A few warnings: If your report is going to be used on a network with multiple users, you may want to be sure that the table(s) is/are locked if you are using this control. The reason is simple: between the time you generate the last page number, and the time you actually run your report, users could be adding rows (or deleting them) in the table(s) used for the report. This might throw your last page number off completely. Another potential network problem is that if you use a hard-coded filename in the code, one user may over-write another user's output file, and you will run into some serious problems. Using fUnique() to get a unique filename is a good idea (as shown in the above code). The second warning is: if you are creating a potentially very large report -- you may not wish to use this because it will take a very long time to generate the report -- why? Because we must render the report twice! Once to find the last page number, and again to actually render (print) it.

There is a complete working example of this custom class on the CD, named PAGEXOFY.CC. To use it (type the following in the command window):

   set procedure to pagexofy.cc additive

This will place the control into the component palette, and when you design your next report, it will be available for your use from the 'Custom' tab of the component palette.

A working report showing this is in the file PAGEXOFY.REP (using data from the CUSTOMER table). The custom control PAGEXOFY.CC is also available. Read the header carefully to make sure you understand what it's doing.

Top/Menu


Custom Page Numbering

There are times when you want your report to start printing the page number at a different number than 1 (often you might have a cover page (see above), or some other reason to print a report starting at, say, page 5, rather than 1 ...) but you actually want the first page of the report to be the one with this new page number.

The solution is pretty simple -- store a value to a custom property of the application framework as below:

   _app.nPagePlus = 4 // 5 - 1 (starting page number - 1)

Then use the custom page number class that is on the conference CD: PAGEN.CC which checks for the existance of "_app.nPagePlus", and if it is there, it adds that value to the report's pageNo property, and displays the new page number on the report. This class otherwise works exactly like the page number custom control that ships with Visual dBASE (in \CUSTOM\REPORT.CC), and is actually a copy of that control with this minor modification (added at the end of the pageValue method):

      if TYPE("_app.nPagePlus" ) == "N"
         nPage += _app.nPagePlus
      endif

You may want to make sure that you stub out the value in _app.nPagePlus when you are done rendering your report. The following code would render your report and set the page number to the value you wish:

      _app.nPagePlus = 4
      do myrep.rep
      _app.nPagePlus = null

The custom control PAGEN.CC is also available. Read the header carefully to make sure you understand what it's doing.

Top/Menu


Preview Form

It is often desireable to allow your user the ability to preview a report, and possibly to select specific pages to print, and/or allow other options. To that end, some effort went into creating the form shown here, which will preview a report, allow the user to see various pages of the report, select pages to print, and more. It uses some of the same code as shown in the "PageXofY" custom control above if the user wishes to view the last page of a report.

The form shown uses a reportViewer control, and some buttons that have various code attached for manipulating the page displayed, and more. The code is pretty well documented, but if there is time during this session, we may get into some of the details of the code.

The form PREVIEW.WFM is available. Read the header carefully to make sure you understand what it's doing. Note that some of the sample reports shown here do not work with this form for some reason ...

Top/Menu


Outputting Reports to HTML

With the world moving more and more to the Internet and the Intranet, it may be desirable to publish your reports as HTML. Well, the Visual dBASE 7 report engine can do this easily. In addition to, and before delving into the information below, the Web Wizards that ship with Visual dBASE 7 give you the ability to generate dynamic reports over the web -- you should seriously look into the use of these Wizards -- they can save you a lot of time and effort!

At its most basic, you can generate a whole report as one HTML file by following these steps:

As you can see, that's pretty easy. When you render the report, it will now be output as HTML, and you can bring that up in your favorite web browser (as long as it supports HTML 3, which most browsers these days do, including Netscape and Internet Explorer -- largely because reports are output as tables ...).

If you store these properties in the designer, then every time you render your report it will be rendered as HTML. This may not be what you want to do. So instead, you might want to create a small program that creates an instance of the report, sets these properties in that instance, and then renders the report. This would look like:

   /* Send MYREPORT.REP to an HTML file: */
   set procedure to myreport.rep additive
   rMyRep = new MYREPORTREPORT() // check the source code to get the right name
   rMyRep.output = 4 // HTMLFile
   rMyRep.outputFileName = "MYREPORT.HTM" // you can include a path ...
   rMyRep.render()
   close procedure myreport.rep

There is one thing that can be a bit confusing -- a Visual dBASE report that has been output as HTML uses a file called "TRANS.GIF" -- but when you view the report, there's no image on the report. This is because "TRANS" is short for "TRANSPARENT" -- the GIF exists (check the directory you have the report generated to), but it's very small and effectively empty -- it's transparent. This .GIF file is used to line up the table columns used for your report, to be sure everything is laid out as close as possible to what you see in the designer. In addition, if you erase this file, because it appears to be useless, your report will look very strange -- you will see a "broken image" icon in your browser (actually, depending on the complexity of your report, you may see a lot of them); and your output will not line up the way you expected it to.

One problem with outputting a report is if it is very large -- a large HTML file can take quite a bit of time to download from the internet. You might want to, instead, output your report one page to a file (one "page" being the same as if you printed the report). This can be done fairly easily, but it does take a bit of coding to make it work.

Here are the details of what you would want to do:

The program "HTMLPAGES.PRG" is included. This program attempts to be a generic program for doing the steps above. No "generic" program can anticipate all possible permutations however ... if you have a report with multiple pageTemplates, then this program won't work well for you. Read the comments at the beginning of it to get an idea how to run it ...

Top/Menu


As you can see, the report designer is very powerful, and with some work, you can do just about anything you would want ... Many of the techniques described in this report can be combined, if you think about what you need to do.

Note that there are many files on the Conference CD as files you might want to examine, including sample reports, custom controls and programs. These are all marked by the spinning CD throughout the paper.

Top/Menu