Data Module designer (dmAssist)
The Data Module design window is a visual design surface
for designing data modules that you can use in your forms, reports, and
labels. Drag and drop the data access components you need for your data
module, then set their properties in the Inspector.
The Data Module designer starting with dBASE Plus 11 is a much more sophisticated tool with regard to Data Module design as in previous versions (dBASE Plus 8, 9 and 10). It not only has a set of tools for visually designing your Data Module but, also has some additional design elements to make data presentation much easier and more efficient.
1 – open a new Data Module in design mode.
In the navigator go to the ‘Data Modules’ tab and double
click on [New Data Module]. Choose to open in Designer.
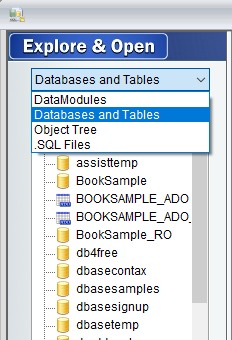
2 – LEFT PANEL: (Explore & Open)
choose what type of elements you are going to add to the Data Module.
The left panel in the Data Module designer is the ‘Explore & Open’ section.
You can choose to:
open an existing datamodule (DataModules)
Add a database/table from the (Databases and Tables) list
View the list of Queries already created in your Data Module (Object Tree)
Get a list of .sql files (.SQL Files).
In this example I will use the Database ‘dbasesamples’ database.
To add the ‘dbasesamples’ database you can double click on it or drag and drop that element to the design surface of the Data Module. This adds the database object (for BDE connected databases) to the design surface of the datamodule as well as open that database and reveal the list of tables available.
NOTE: the BDE Database connections (whether it is an ODBC based connection to another database or a native .dbf table connection) are shown with this icon . The ADO connections are shown with this icon
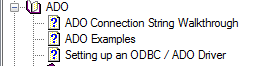
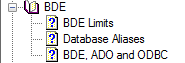
NOTE: see these topics in the help for BDE vs. ADO related connections:
Next add your tables by doing the same (double click or drag and drop).
NOTE: If there is no database alias you can click and drag a table from the Navigator to the design surface of the Data Module designer.
In this example I am adding the ‘Customers’ and ‘Orders’ tables from the ‘dbasesamples’ database. This creates a query object for each table in the datamodule. Just like when you add a table to the design surface of a form in the form designer.
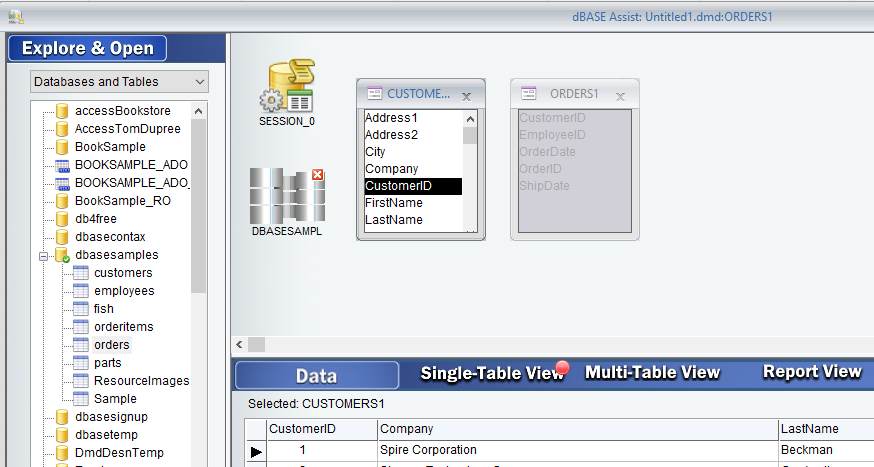
3 – RIGHT TOP PANEL: (Design surface)
Creating a Parent/Child relationship:
At this point I want to create a connection with the two tables. I can simply click and drag the field from the parent table to the field in the child table that I want to relate.
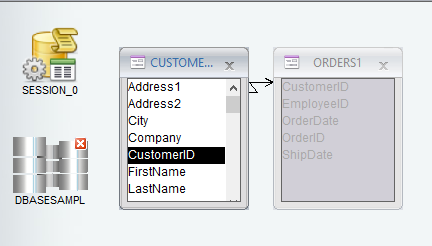
Here I am making the Orders table the child of the Customers table by connecting the ‘CustomerID’ field (clicking and dragging this field from Customers to Orders).
At this point you may get a dialog which gives you options for how to make the parent/child connection.
- Indexed (For a simple BDE index on the child tbl that matches the parent field)
- Non-Indexed (uses sql based connection. When no .dbf table simple index is available)
After creating the connection you will see an arrow between the parent and child table.
4 – RIGHT LOWER PANEL: (Data presentation)
You will notice 3 sections: ‘Single-Table View’, ‘Multi-Table
View’, ‘Report View’
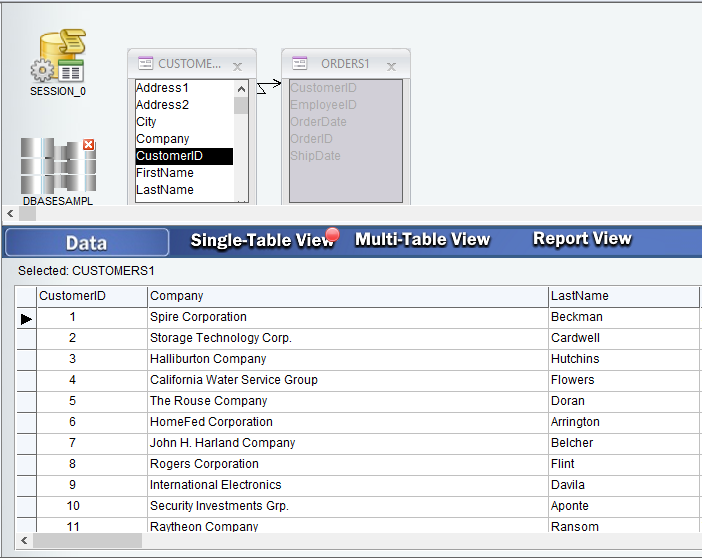
Single-Table View:
This is where the data will be presented ‘as is’ for the Query that has the current focus on the Design Surface. Each Query you click on in the design surface will show the raw table data in this section.
NOTE: when clicking on any child table in the Design surface, to give it focus, the data shown will be filtered based on its relationship with the currently selected row in the parent table.
Multi-Table View:
This is where you can show only that data (from any of the tables) that you want. You can simply click and drag the fields from each query object to the LOWER PANEL (DATA) section while in ‘Multi-Table View’.
In this case I will add the ‘CustomerID’, ‘FirstName’, ‘LastName’ from the parent ‘Customers’ table and then the ‘OrderID’, ‘OrderDate’ and ‘ShipDate’ from the ‘Orders’ table.
NOTE: you can add the fields in any order you like.
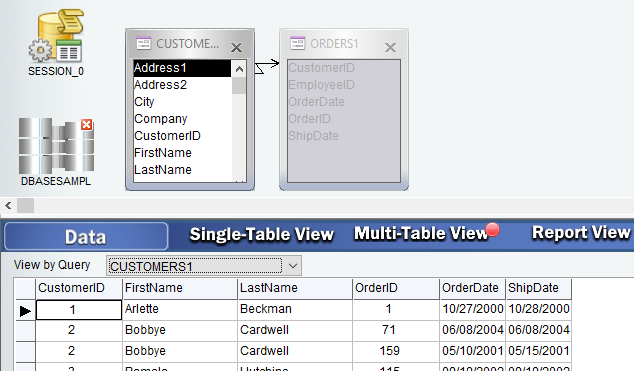
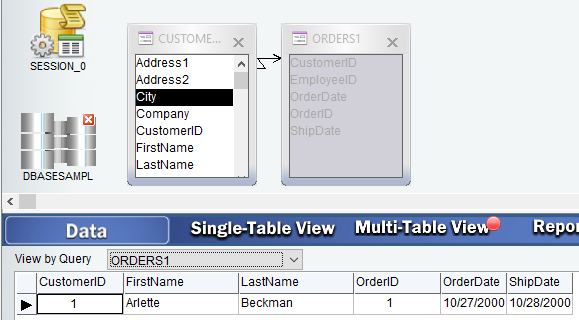
You can also change the “View by Query”. Choosing the parent table will show the data for all. Choosing a child table will show the data that is filtered by its relationship to the parent row.
For example this is a View showing the Orders query data (with the rowset in the parent query on the first row)…
Report View:
This view will only show the data in report format if you have used the ‘Multi-Table View’ to set up your data. The ‘Report View’ will give you a live presentation of your data in real time.
You can also save the report (.rep). Just right click in the Report View area and choose ‘Save Report as’.
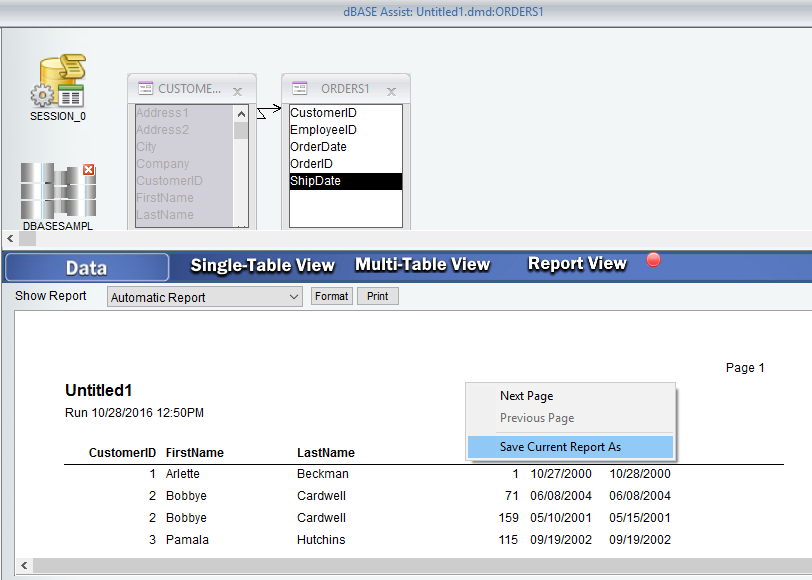
This will save the report in a dbase report format (.rep) and will also associate this report with the datamodule.
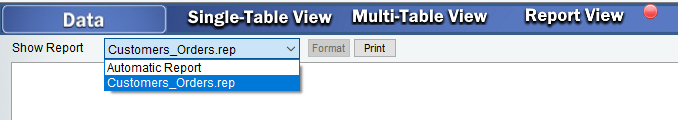
You can create different ‘Multi-Table View’ data configurations and then save them in different reports so they will always be available.
As you create and add reports they will always be available as an .rep (see reports tab in the Navigator). They will also be attached to the datamodule so you can choose which report you want to view.
You can also remove references to any .rep in the Data Module designer by going to the Menu option ‘Reports | Add/Remove Reports from Data Module’
NOTE: this does NOT remove the actual report file (.rep). Just removes its reference in the Data Module.
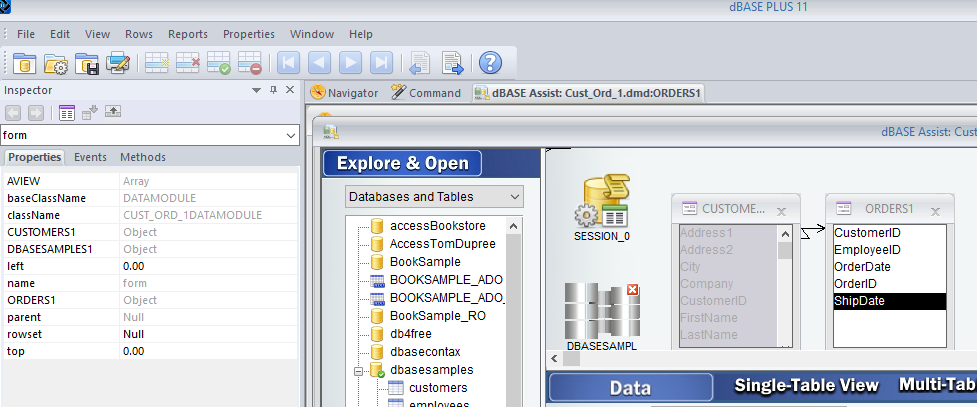
ADDITIONAL NOTES
You can always view/edit the datamodule / database and or query properties through the inspector. You can go to the Menu option ‘View | Inspector’ or hit F11 to open the inspector.
Right-Click menu options in Design Surface will also allow you to :
1 – Add Database Connection
2 – Add Table
3 – Add Query from .SQL File
4 – Add Stored Procedure
5 – Add Session
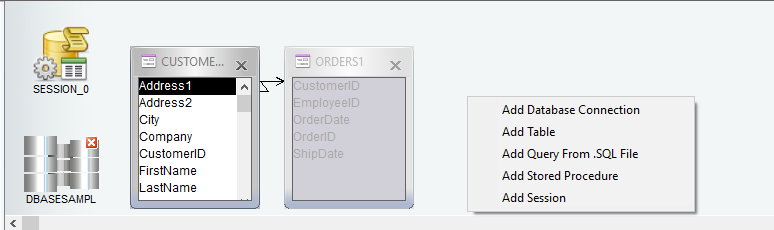
Each of these options will start a wizard to help you through the process.